
Below consensus, headline m/m at 0.1% vs. 0.3% Bloomberg consensus, and core 0.2% vs. 0.3% consensus. Headline and core m/m annualized inflation in Figures 1 and 2, along with chained, sticky price, trimmed, and PCE.
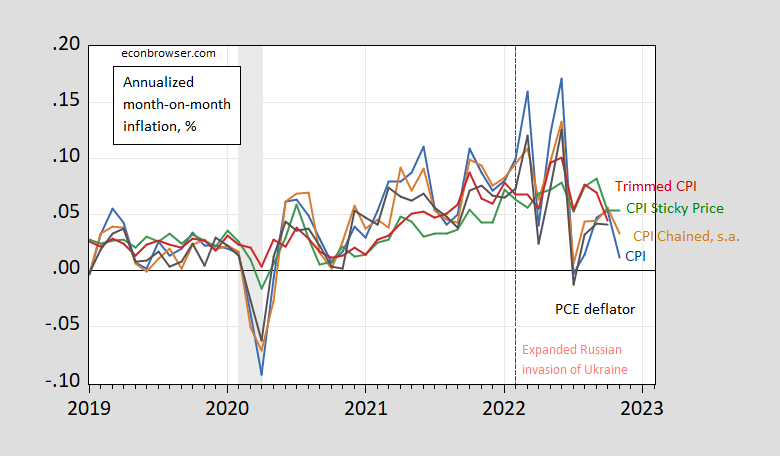
Figure 1: Month-on-month inflation of CPI (blue), chained CPI (brown), 16% trimmed CPI inflation (red), sticky price CPI inflation (green), personal consumption expenditure deflator inflation (black), all in decimal form (i.e., 0.05 means 5%). Chained CPI seasonally adjusted using geometric Census X13 (brown). NBER defined recession dates (peak-to-trough) shaded gray. Source: BLS, BEA, NBER, and author’s calculations.
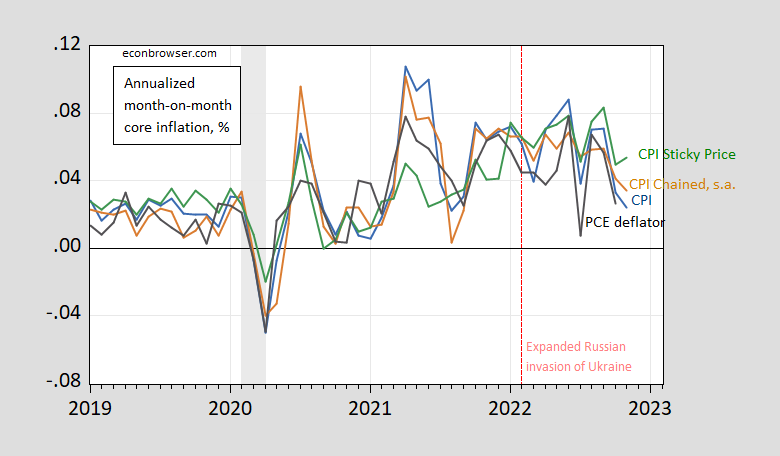
Figure 2: Month-on-month inflation of core CPI (blue), chained core CPI (brown), sticky price core CPI inflation (green), personal consumption expenditure core deflator inflation (black), all in decimal form (i.e., 0.05 means 5%). Chained CPI seasonally adjusted using geometric Census X13 (brown). NBER defined recession dates (peak-to-trough) shaded gray. Source: BLS, BEA, NBER, and author’s calculations.
The CME Fed Watch tool sets implied Fed funds rate to be set tomorrow at 4.27%, down from 4.44% yesterday, while that for the February 1st meeting down from 4.82% to 4.76%, both suggesting a flatter Fed funds trajectory than before the CPI release.
The 2s10s spread increased (became less negative), while the 3m10s dropped slightly – so some steepening at the 2 to 10 year of the spectrum. The 5 year Treasury-TIPS breakeven fell 4 bps.
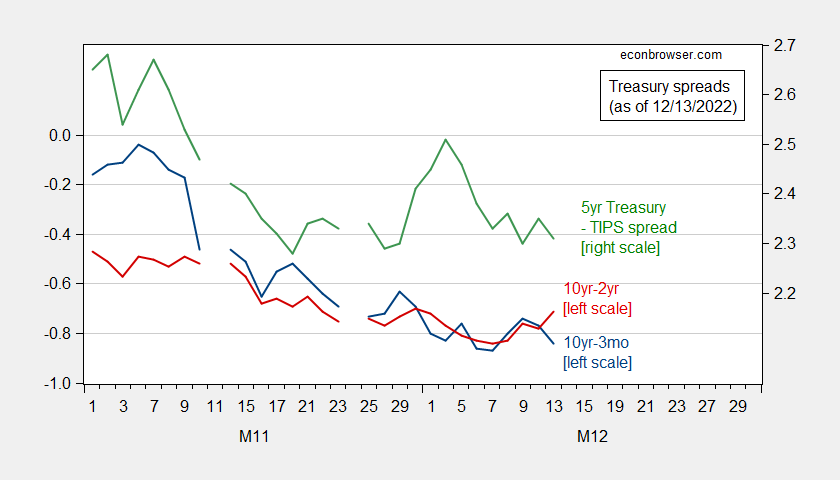
Figure 3: 10yr-3mo Treasury spread (blue, left scale), 10yr-2yr spread (red, left scale), and 5yr Treasury-TIPS breakeven (green, right scale), all in %. Source: Treasury via FRED, author’s calculations.
CEA discussion here.
More By This Author:
So You Think We Were In a Recession in 2022H1? – Last Observations for 2022
10yr-3mo Term Spread And Recession, Down Under
GDP Prospects


Comments
Log in or sign up to join the conversation.