
Here’s a picture of the 10yr-3mo term spread in Australia:
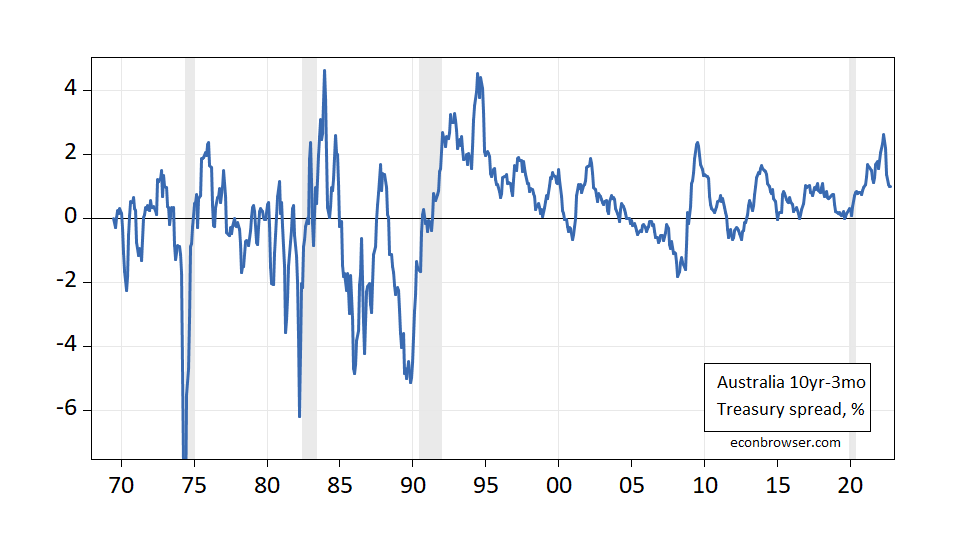
Figure 1: 10yr-3mo Australian Treasury spread, % (blue). ECRI peak-to-trough recession dates shaded gray. Source: OECD Main Economic Indicators, ECRI, and author’s calculations.
A probit model estimated over 1968-2021 yields (assumes no recession occurred as of December 2022):
Prob(recessiont+12) = -1.585 – 0.253 spreadt + ut+12
McFadden R2 = 0.13, NObs = 630. Coefficients significant at 5% msl bold. The spread is in percentage points.
While the spread is statistically significant, it would’ve completely missed the 2019-2020 recession. Indeed, this model would’ve missed the 2008 recession, even using as low as a 20% threshold. This result partly validates Not Trampis’s view; however, a rising 3-month Treasury rate doesn’t seem to predict recessions well either.
Note that Karunaratne (2002) does show the spread does predict growth and recessions well, for data through 1997. However, his definition of a recession is based on the two-consecutive-quarter criterion, and so differs from the approach that uses an NBER or ECRI indicator.
The Australian yield curve as of today:
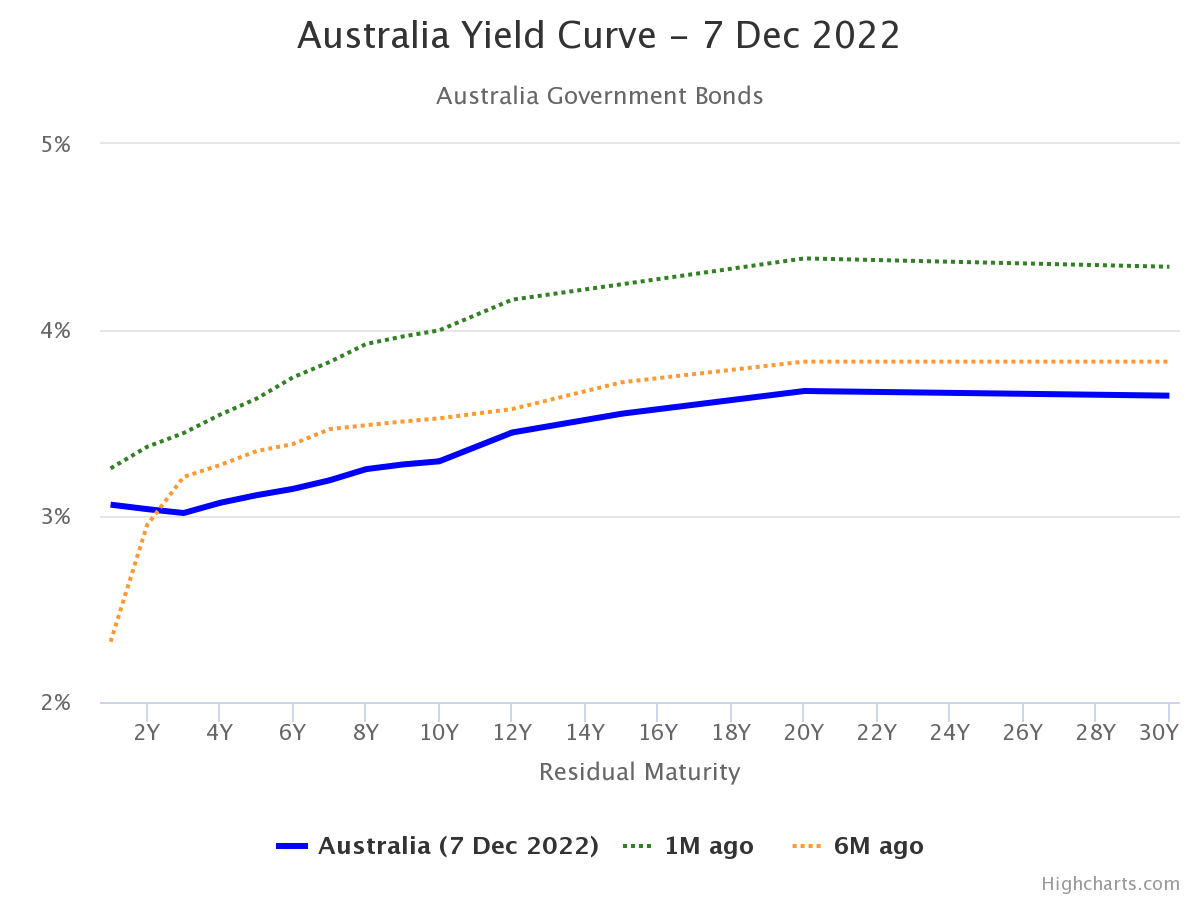
Source: worldgovernmentbonds.com.
What inversion there is 3yr-2yr; the curve is indeed much flatter than 6 months ago.
More By This Author:
GDP ProspectsTerm Spreads Around The World, As Of December 6, 2022
Real Wages During And Post-Pandemic


Comments
Log in or sign up to join the conversation.