
With apologies to John Donne.
Jim provided some key points in his Thursday post regarding the 21Q2 advance figures. Here are my additional takeaways: (1) the Administration’s forecast locked down in February looks prescient; (2) Final sales were higher than GDP, (3) exports have not buttressed growth, partly because of slow rest-of-world growth, (4) price growth is a rising share of nominal GDP growth.
Growth Disappointment (Relative to June…)
First, the GDP release in context of forecasts.
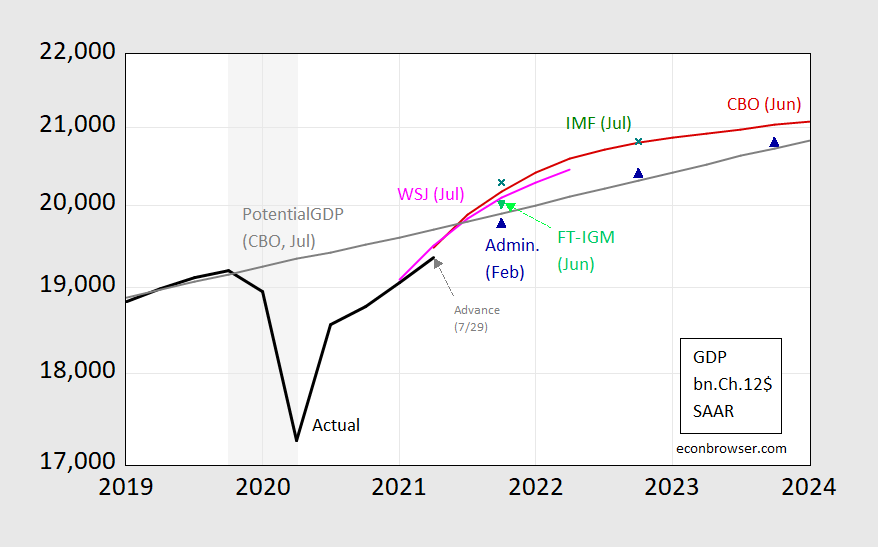
Figure 1: GDP as reported on 7/29 in 2021Q2 advance release (black), Administration FY22 forecast (blue triangle), CBO June forecast (red line), FT-IGM (light green triangle), IMF July WEO (green x), potential GDP as estimated by CBO in July 2021 (thick dark gray line). Dates indicated denote when the forecasts were “locked down”. Source: BEA 2021Q2 advance release, OMB FY’22 Budget, WSJ July survey, and FT-IGM survey (June), CBO (February, July), IMF WEO (July), and author’s calculations.
There was an annual revision which pushed down slightly reported GDP. However, the forecasted GDP levels shown (which are imputed by the author assuming latest available GDP levels at the time of forecast — the forecasts themselves are reported in growth rates) reflect the earlier optimism. The Administration’s FY2022 Budget forecasts stand out as prescient in this regard.
One shouldn’t forget that relative to last year, outcomes are better than expected (W. Edelberg).
Aggregate Demand vs. GDP
Second, final sales — that is GDP minus decumulation in inventories — differs measurably from the highlighted GDP number. Final sales are higher, reflecting aggregate demand outstripping production.
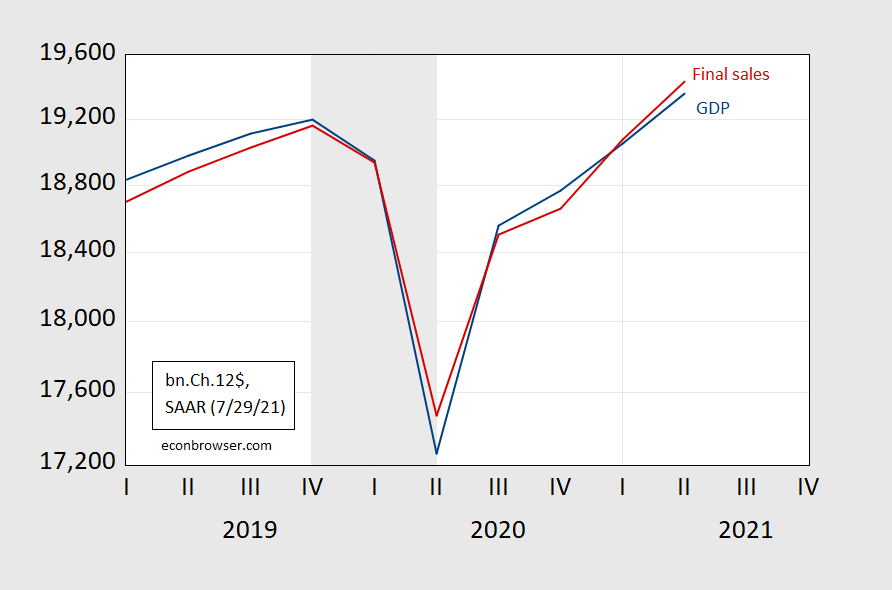
Figure 2: GDP (blue) and final sales (red), both in billions Ch.2012$ SAAR. NBER defined recession dates shaded gray. Source: BEA, 2021Q2 advance release.
This shows up in 2021H1 final sales growth outstripping GDP growth.
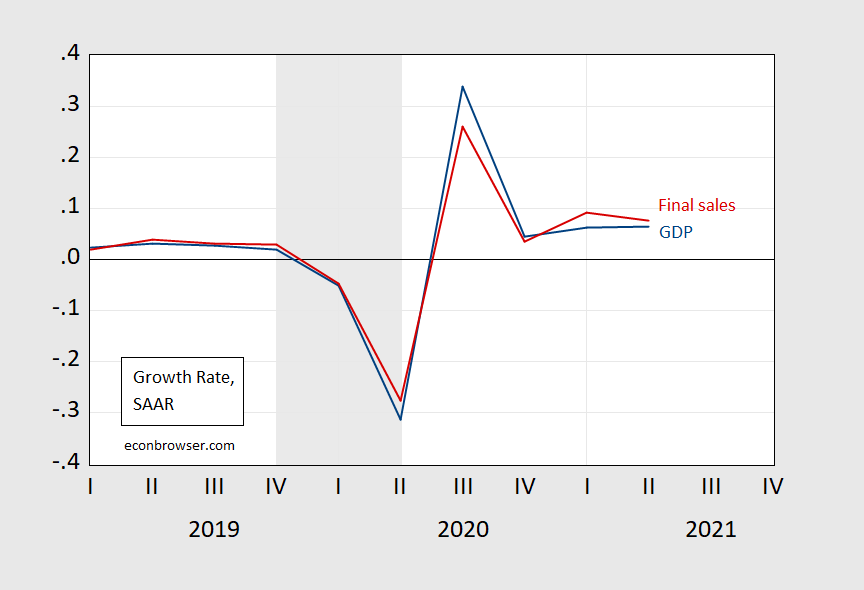
Figure 3: Quarter-on-quarter growth rates for GDP (blue) and final sales (red), in billions Ch.2012$ SAAR. NBER defined recession dates shaded gray. Source: BEA, 2021Q2 advance release.
In normal times, we would think of an equilibrating mechanism where (with supply passively adjusting to demand) inventories were rebuilt. Given these times, rebuilding (to an unknown-to-us optimal inventory-to-sales level) will take an unknown amount of time. Partly it depends on our ability to source from overseas.
The International Dimension
Imports have not recovered to the extent one might have expected in a normal recession. In addition to impediments left over from the Trump Administration, there are transport and supply constraints.
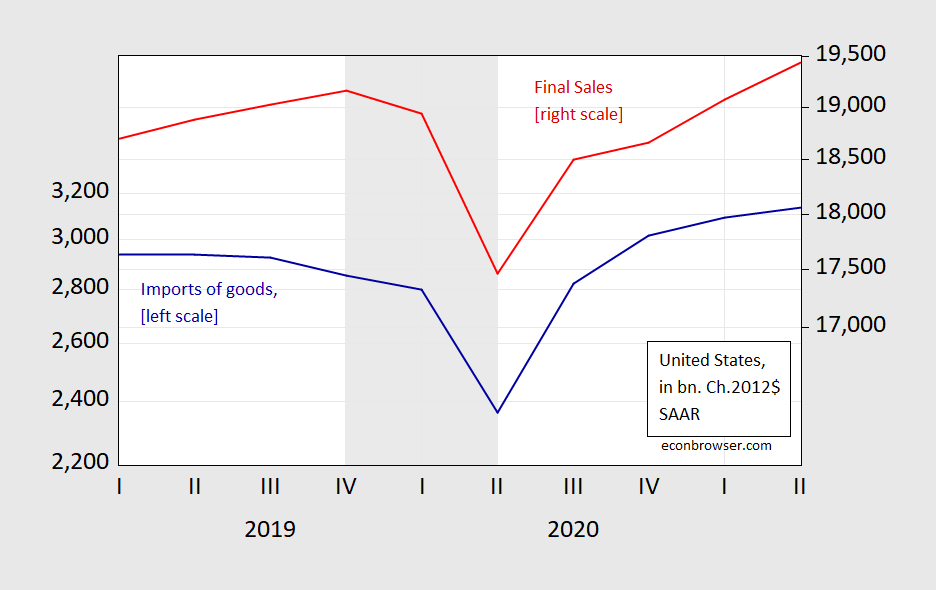
Figure 4: US Imports of goods (blue, left log scale), and US Final sales (red, right log scale), both in bn.Ch.2012$, SAAR. NBER defined recession dates shaded gray. Source: BEA, 2021Q2 advance release, NBER.
While capital goods have recovered at a faster pace, and now constitute a higher share of final sales than pre-pandemic, it’s not clear that given the reallocation of demand composition, this is “enough”.
One point highlighted by Jim’s growth accounting is the small share of US GDP growth accounted by exports. This outcome is shown in a different way in Figure 5.
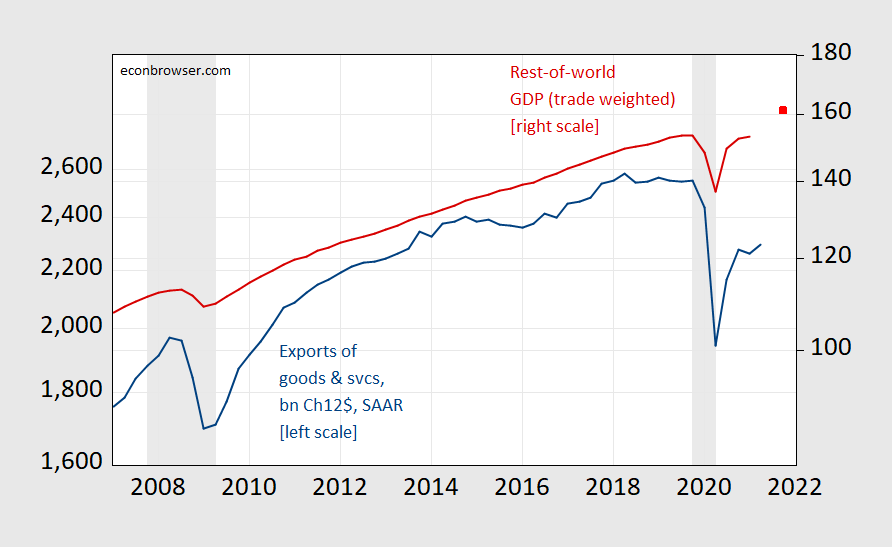
Figure 5: US Exports of goods and services, in bn.Ch.2012$, SAAR (blue, left log scale), and Rest-of-World trade weighted GDP, 2005=100 (red, right log scale), and extrapolated RoW GDP (red square, right log scale). 2021Q4 observation extrapolated using IMF WEO July update implied RoW Q4/A4 growth rate applied to 2020Q4 RoW GDP. NBER defined recession dates shaded gray. Source: BEA, 2021Q2 advance release, Dallas Fed DGEI, IMF WEO July database, NBER, and author’s calculations.
The stall in 2021H1 export growth is clearly linked to the slowdown in RoW slowdown in Q1. We don’t have a reading on Q2 RoW growth, but I used the IMF’s July World Economic Outlook forecast to impute the end-2021 level; despite the IMF’s markdown of particularly emerging market economy , RoW output is forecasted to be higher. That might provide additional support to aggregate demand going forward – although actual outcome will depend on the resolution of supply constraints. (This post outlines the impact of Covid-19 related public health measures impacting country exports — and hence our imports.)
One point that I want emphasize comes from the IMF World Economic Outlook‘s July update, wherein emerging market growth has been marked down (due in large part to the Delta variant’s spread and resulting impairment of economic activity). That means that US policymakers can not just blithely ignore developments in the rest-of-the-world. Our fortunes are tied up with the fortunes of those in the emerging market economies (perhaps as much as those who continue to refuse both to get vaccinated without specific medical grounds, and to undertake social distancing measures).
A Decomposition of Nominal GDP
The extent that supply constraints weighed on 2021Q2 is shown in Figure 6.
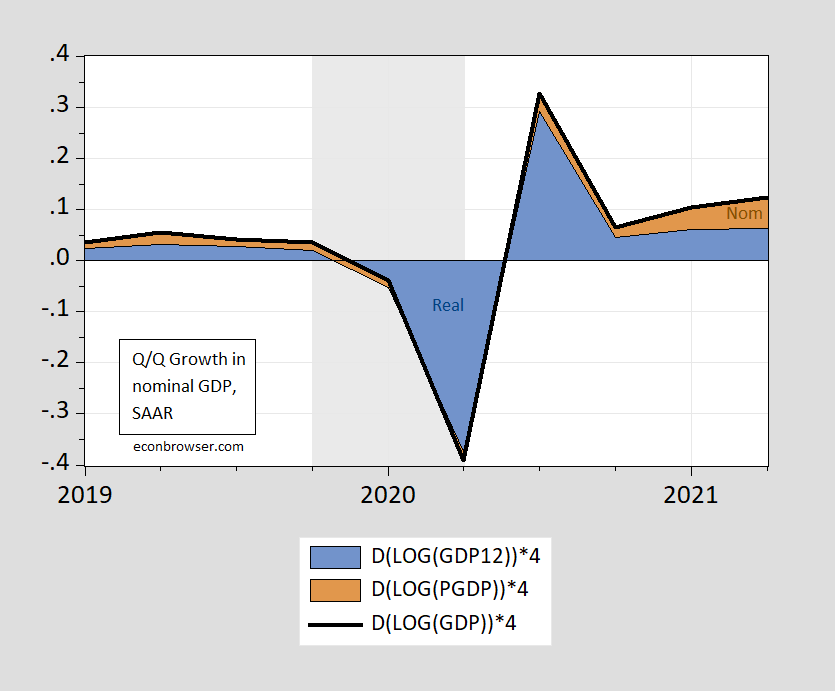
Figure 6: Quarter-on-quarter growth rate in nominal GDP (black line), in real GDP (blue area), and in price deflator (brown area), all SAAR. Growth rates calculated using log differences. NBER defined recession dates shaded gray. Source: BEA, 2021Q2 advance release, NBER, and author’s calculations.
Whether these price pressures persist depends on the extent of supply bottlenecks, the extent of elevated aggregate demand, and expectations of inflation (which work their way into pricing decisions, and into wage pressures). Yesterday’s personal income and outlays release suggested lower-than-anticipated and upward pressure on the PCE deflator, while (declining) employment compensation growth below consensus indicates that higher inflation hasn’t yet fed into substantial accelerating wage growth (see Jason Furman for more). For me, I see the Q2 share of price level growth to nominal GDP growth as a transient high.
I include the latest available market and survey based indicators in the wake of the GDP, personal income and outlays, and employment cost releases.
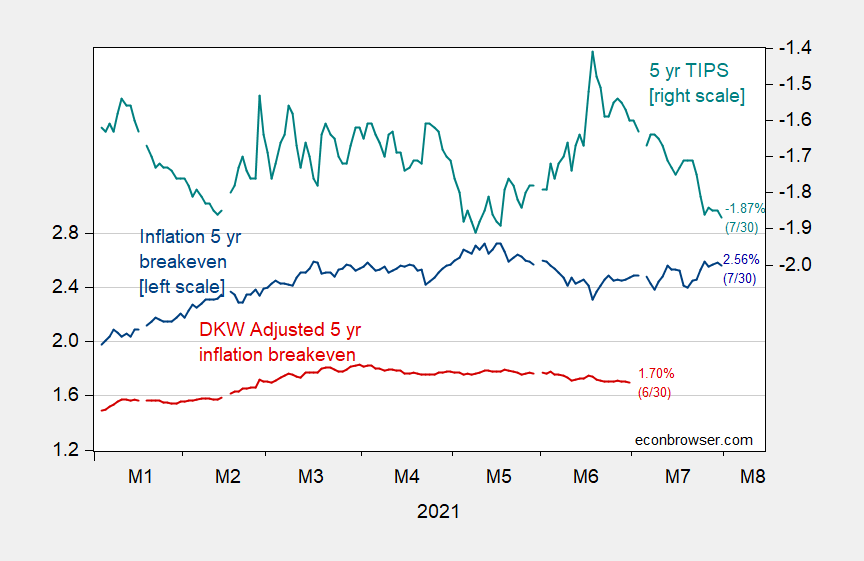
Figure 7: Five year inflation breakeven calculated as five year Treasury yield minus five year TIPS yield (blue, left scale), five year breakeven adjusted by inflation risk premium and liquidity premium per DKW (red, left scale), 5 year TIPS yields (teal, right scale), all in %. Source: Fed via FRED, Treasury, KWW following D’amico, Kim and Wei (DKW) accessed 7/7, author’s calculations.
The five year breakeven has barely budged in the way of these releases, and remains at 2.56%. If the estimated inflation and liquidity risk premia gaps have remained constant since 6/30, then anticipated average inflation over the next 5 years is still in the range of 1.8%.


Comments
Log in or sign up to join the conversation.