
The Bureau of Economic Analysis announced today that seasonally adjusted U.S. real GDP grew at a 6.5% annual rate in the second quarter. That’s well above the 3.1% average growth that the U.S. experienced over 1947-2019. Kudos to Federal Reserve Bank of Atlanta economist Patrick Higgins, whose nowcast of 6.4% that Menzie highlighted yesterday anticipated today’s release on the nose.
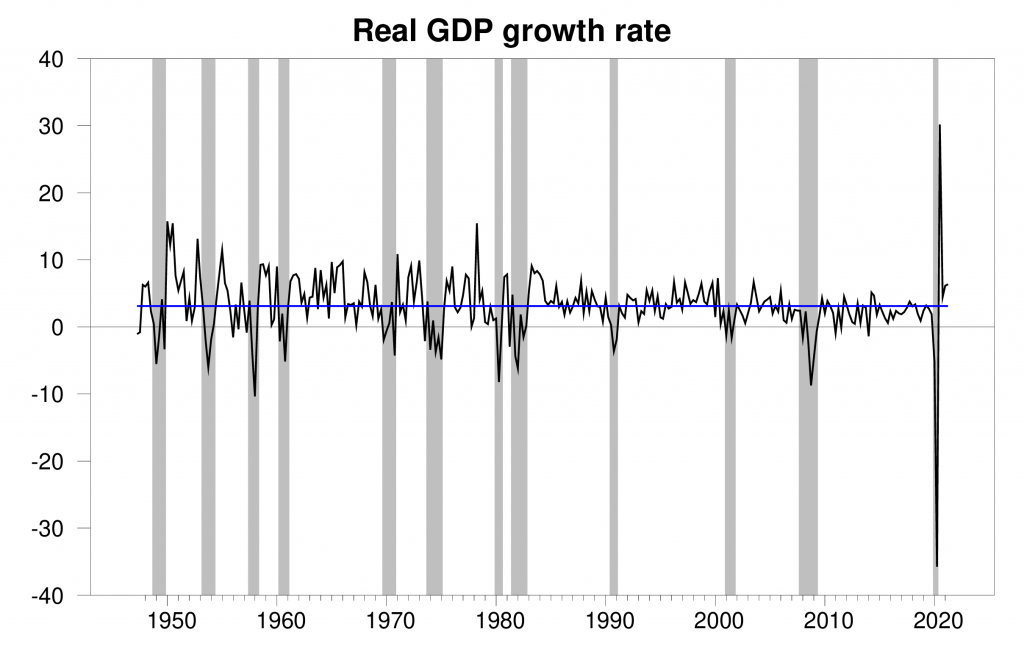
Real GDP growth at an annual rate, 1947:Q2-2021:Q2, with the 1947-2019 historical average (3.1%) in blue. Calculated as 400 times the difference in the natural log of GDP from the previous quarter.
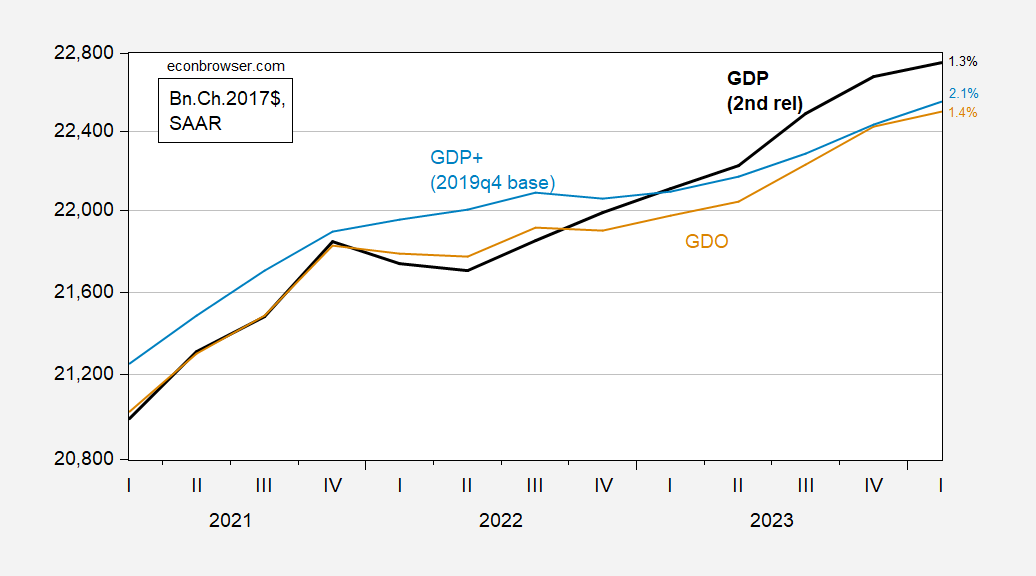
The Q2 growth puts the level of GDP at a new high, 0.8% above the peak that was reached in 2019:Q4 before the COVID recession began.
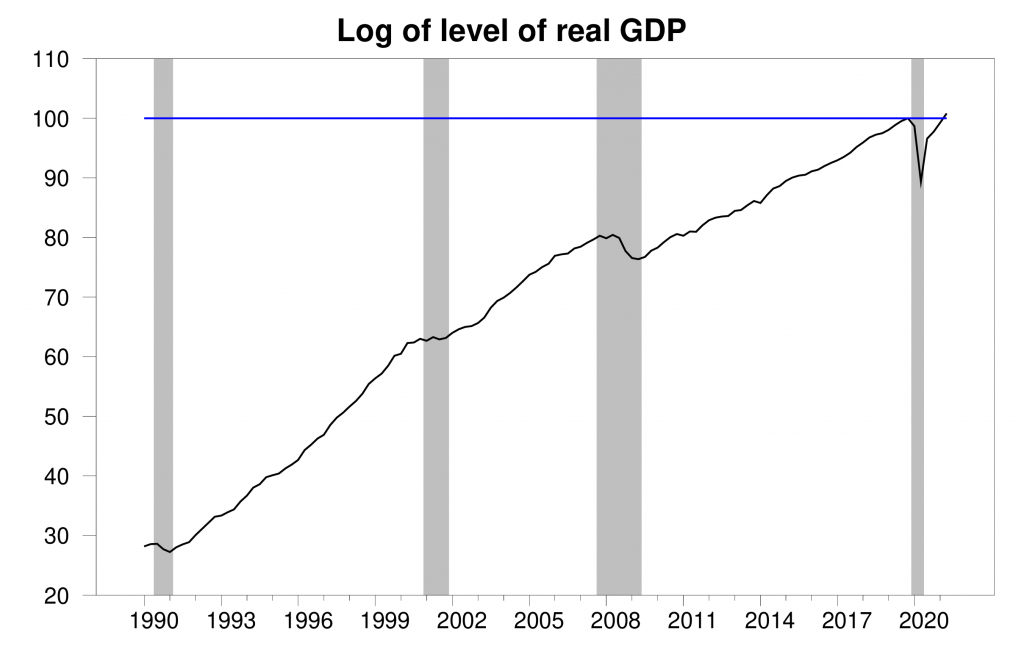
100 times the natural logarithm of the level of real GDP, 1990:Q1 to 2021:Q2, normalized at 2019:Q4 = 100. A movement on the vertical axis of 1 unit corresponds to a 1% change in the level of real GDP. The value for 2021:Q2 of 100.8 indicates that real GDP in 2021:Q2 was 0.8% above the value in 2019:Q4.
The new data put the Econbrowser recession indicator index at 0.2%, historically a very low value. The number posted today (0.2%) is an assessment of the situation of the economy in the previous quarter (namely 2021:Q1), where we use the additional quarter to allow for data revisions and to gain better precision. This index provides an automatic procedure that we have been implementing for 15 years for assigning dates for the first and last quarters of economic recessions. As we announced on January 28, the COVID recession ended in the second quarter of 2020. The NBER Business Cycle Dating Committee subsequently made the same announcement on July 19.
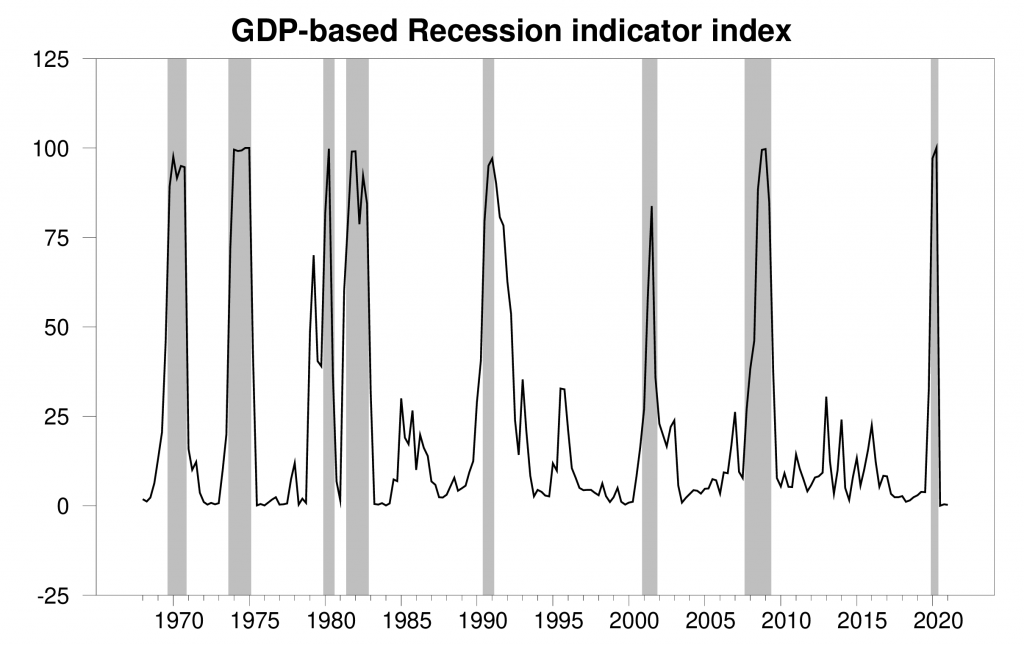
GDP-based recession indicator index. The plotted value for each date is based solely on the GDP numbers that were publicly available as of one quarter after the indicated date, with 2021:Q1 the last date shown on the graph. Shaded regions represent the NBER’s dates for recessions, which dates were not used in any way in constructing the index.
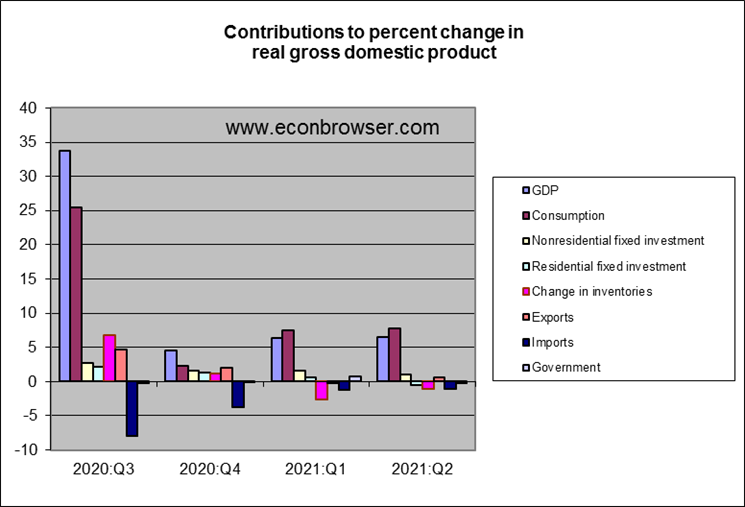
In terms of the breakdown of the Q2 GDP numbers, consumption spending, spurred by fiscal stimulus payments, led the way. It was a little disappointing to see residential fixed investment (which comes from construction of new homes) actually falling in Q2. The monetary stimulus from low interest rates has succeeded in spurring higher prices for homes. Tobin’s Q theory of investment predicts that this should stimulate new construction, boosting GDP through this mechanism.
I have a new research paper in which I argue that potential GDP, which I define as the level of output that would result if wages and prices were perfectly flexible, depends not just on traditional factors such as available workers, the capital stock, and production technology, but also on the match between specialization in those factors and the configuration of product demands. I’m seeing numerous accounts consistent with the view that problems with supply rather than a shortfall of demand are a key factor holding back aggregate growth at the moment.
Comments
Log in or sign up to join the conversation.