
Reader Erik Poole commenting on this figure (in this post) writes:
Assuming that the all the inflation forecasts are one-year forecasts in the above chart, do we have any kind of inflation expectations data for shorter time frames, such as 6 months?
The above is a fancy way of asking: are financial markets and professional forecastersb really that bad at forecasting inflation?
Glancing at the above chart, it appears to make a good argument for adaptive expectations driving economic agents inflation expectations.
I’m sympathetic to this view at the one-year horizon. Adaptive expectations is what I learned as an undergrad in my first macro course in 1982 (with an autoregressive coefficient of unity, the adaptive approach underpins the accelerationist hypothesis). I also use this as the starting point for talking about dynamics in my macro course this semester, for pedagogical reasons. However, I soon move to more complicated approaches, for reasons laid out in Coibion et al. (JEL 2018).
In point of fact, if we are to evaluate these measures in terms of forecasting, rather than explaining behavior, then adaptive expectations do not appear to be the best, informally assessed. To see why, see this graph of forecast errors.
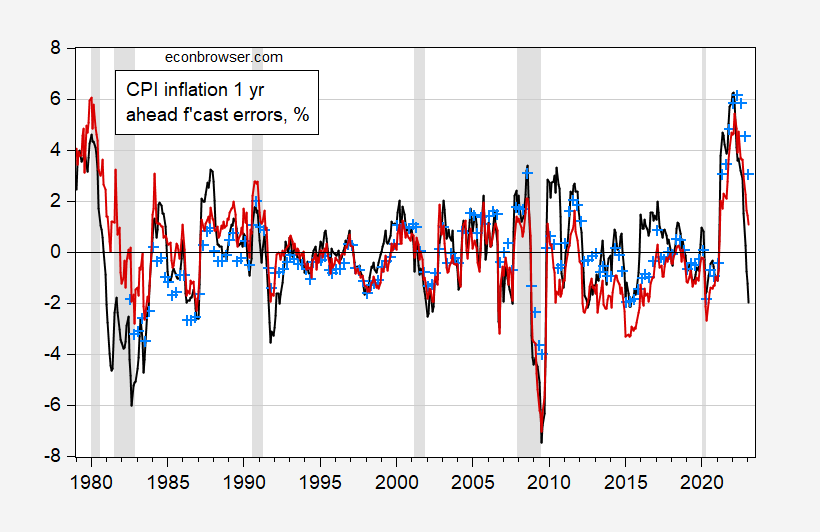
Figure 1: Year-on-year CPI inflation forecast errors from lagged year-on-year inflation (black), Survey of Professional Forecasters median (sky blue +), and Michigan Survey of Consumers (red), all in %. NBER defined peak-to-trough recession dates shaded gray. Source: BLS via FRED, Philadelphia Fed, University of Michigan Survey of Consumers via FRED, NBER, and author’s calculations.
Applying a common sample (SFP is reported once a quarter starting in 1982, and Michigan starts in 1979), one finds that the mean error is smaller for adaptive expectations, but the RMSFE is much larger – 1.86 vs. 1.59 for SPF and 1.54 for Michigan.

Note that this pattern of RMSFEs is accentuated if we omit the Biden period; then the adaptive approach yields an RMSFE of 1.68 vs. 1.19 for SPF and 1.37 for Michigan.
More By This Author:
One Year Ahead Inflation Expectations
How Well Does a Naive Expectations Augmented Phillips Curve with Cost Push Shocks Fit PCE Inflation?
Is The Lagged One Year Inflation Rate A Good Predictor Of Five Year Ahead Inflation?


Comments
Log in or sign up to join the conversation.