

I asked this question of myself, as I prepared my lecture notes. As it turns out, not too badly, over the 1986-2022 period.
Consider:
![]()
Where the left hand side variable is annualized quarter-on-quarter PCE inflation, y is log GDP, yf is log full-employment or potential GDP, expected inflation is the Michigan survey one-year-ahead expectation, and z is a cost-push variable composed of the NY Fed Global Supply Chain Pressure Index (GSCPI), quarter-on-quarter annualized oil price inflation, and a lockdown dummy variable ( taking on a value of 1 March 2020 to February 2021)
A simple regression of inflation on output gap yields an adjusted R2 of zero. The full model estimated over the entire sample yields an adjusted R2 of 0.57, and a pretty good fit (tan line).
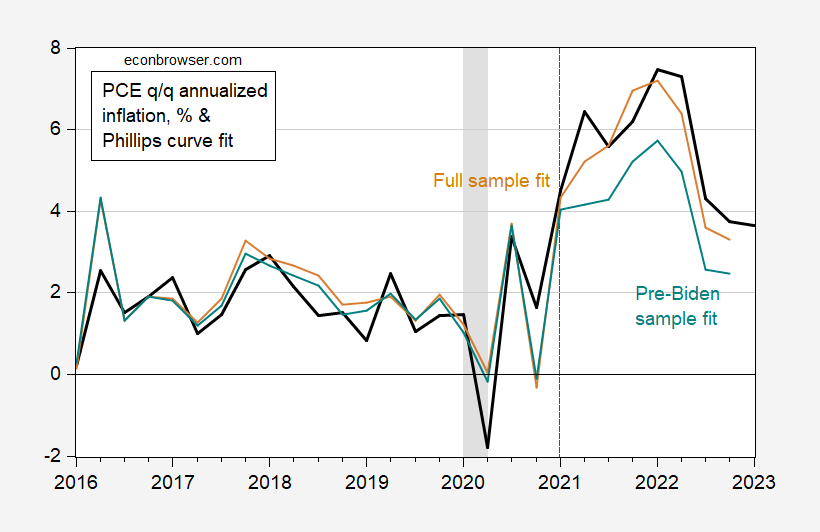
Figure 1: Actual quarter-on-quarter annualized PCE inflation (black), in-sample fit from augmented Phillips curve equation estimated on 1998-2022 (tan), and in-sample and out-of-sample fit for equation estimated on 1998-2020 (teal). 2023Q1 is for first two months of Q1. NBER defined peak-to-trough recession dates shaded gray. Source: BEA, NBER, and author’s calculations.
Of course, it’s pretty easy to fit in-sample (adjusted . The biggest recent prediction error is 0.9 ppts in 2022Q2 (the quarter after the expanded Russian incursion into the Ukraine). The question is whether we should’ve been surprised by inflation outcomes, given parameter estimates before the Biden administration. I attempt to assess this by estimating the model over the 1998-2020 period (adjusted R2 of 0.36) and predicting out of sample. This prediction is shown as the teal line; the prediction error is 2.3 ppts in 2022Q2 (note that I don’t say forecast error, as I’m using ex post realizations of the right hand side variables to make predictions; alternatively, you can call the 2021-22 period an ex post historical simulation).
The difference is driven by the lower coefficient associated with expected inflation in the truncated sample (0.24 vs. 0.44 in full sample) and lower coefficient on the supply chain pressure coefficient (0.60 vs. 0.92 in full sample).
The full sample estimates indicate that if GSCPI had held at 2020Q4 levels, the 2021Q4 inflation of 6.4% would have instead been 3.2% (with all other variables evolving as they did, which is of course unrealistic).
More By This Author:
Is The Lagged One Year Inflation Rate A Good Predictor Of Five Year Ahead Inflation?Nonfarm Employment Rises
Weekly Macro Indicators Through End-March


Comments
Log in or sign up to join the conversation.