
As herein penned last Saturday: “…Gold is well within range for a fresh All-Time High (above 2538 basis December) in the new week…”

And so it came to pass, the yellow metal (basis December) trading yesterday (Friday) to as high as 2548, an albeit rather scant +10 points above that contract’s prior All-Time High of 2538 set this past 17 July.
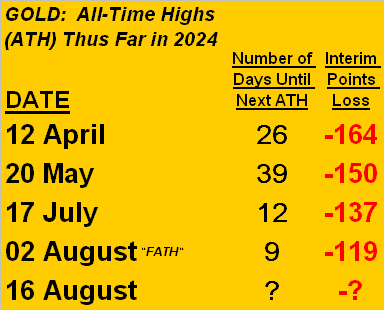
“Marginal” either way perhaps, but they all count. Regardless: for the 5,944 trading days so far this century, Gold has now essentially recorded an All-Time High on 274 of them (which for those of you scoring at home is once every 22 trading days, i.e. once per month on average). ‘Course, the standard deviation of that is massive: after 06 September 2011, Gold did not record its next All-Time High until 24 July 2020, a “high-less” 2,236-trading-day run of nearly nine years.
But here’s where it gets interesting. Recall The Gold Update from back on 25 May entitled “Gold’s Marginal High and Habitual Cry“? The latter two words therein refer to Gold typically — and oft swiftly –getting dumped following just such marginal All-Time Highs. Therefore were history to ad nauseam repeat, Gold shall be met with selling next week. To wit, Gold’s recording of All-Time Highs this year-to-date, followed by fallout as the near-term fate:
“But I’m thinking maybe it’s different this time, mmb…“
Well, dear Squire, ’tis always requisite that one takes the other side of the trade. Thus if you could kindly come to market with some serious size, you can skyrocket the silly Shorts beyond their stops as you relentlessly drive Gold’s price up.
But truly to Squire’s point: note in the above table a lessening of points lost after each All-Time High, in turn more swiftly and satisfyingly squeezing the Shorts. Puts one in mind of Herbert Lom as Chief Inspecteur Dreyfus: “I’m squeezing. And the more I squeeze, the freer I feel. I’m in ecstasy. And then suddenly, suddenly my problem is solv-ved.” –[The Return of the Pink Panther, UA, ’75]).
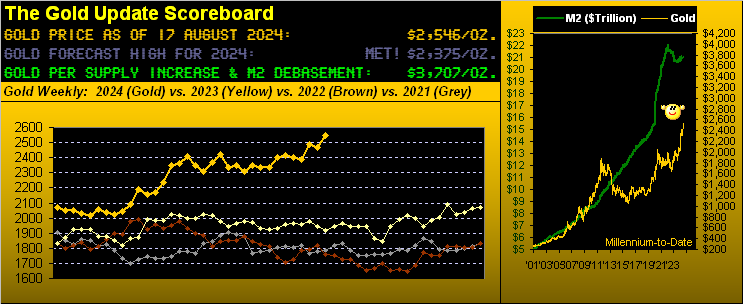
To be sure per the opening Scoreboard, Gold having settled the week at 2546 still finds it -31% below its Dollar debasement value of 3707. But in assessing “The Now” and this recent hankering Gold has to pull back following fresh All-Time Highs, lets look to a nearer-term view of the yellow metal vis-à-vis its smooth valuation line. Such line is borne of Gold’s price changes relative to those of the other four primary futures markets which comprise BEGOS (Bond / Euro / Gold / Oil / S&P 500). Here’s the current year ago-to-date stance — appearing a bit stretched — as updated daily for the website:
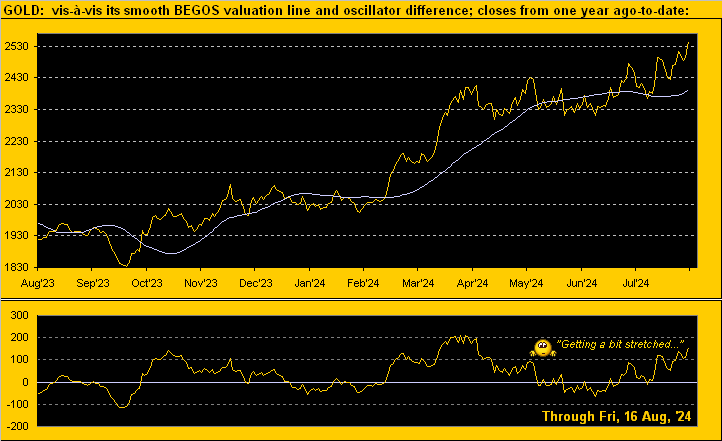
Moreover, when markets breakout, obviously they deviate — on occasion significantly — from whatever mean by which they’re otherwise regularly measured. So again per Squire’s notion, perhaps ’twill be different this time, (which for you WestPalmBeachers down there would mean Gold shan’t retract as has recently been its post-All-Time Highs wont). En tout cas, on verra…
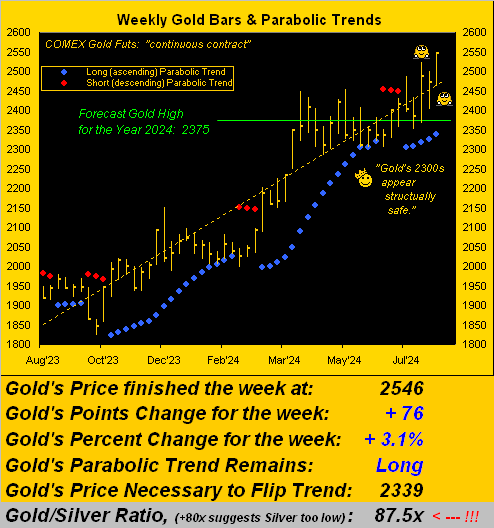
What we can presently see, however, are Gold’s weekly bars, again from one year ago-to-date, along with the dotted parabolic trends. Per the graphic, Gold has better than 200 points of wiggle room between present price (2546) and the rightmost blue “flip-to-Short” dot at 2339. Further, should price fall following this latest All-Time High, the 2300s in general look structurally safe for Gold:
But hardly does the Stateside economy look safe. As we “X’d” (@deMeadvillePro) this past Tuesday: “Econ Baro reaches its lowest oscillative level since 24 November 2009”, since slipping further still. ‘Course if you don’t follow the Baro, you don’t see it; neither does the FinMedia nor Herd nor Fed.
However, we’re now told ’tis baked in the cake that not only shall the Federal Open Market Committee vote to cut its Bank’s Funds Rate come the 18 September Policy Statement, but that it may well be a double-pip cut of -0.50% as opposed to just -0.25%, the latter by the Economic Barometer saying they should already have so done on 31 July. (Again, too bad the FOMC members don’t read deMeadville … a shameless plug perhaps, but most gratifying). For here’s what they’re missing:
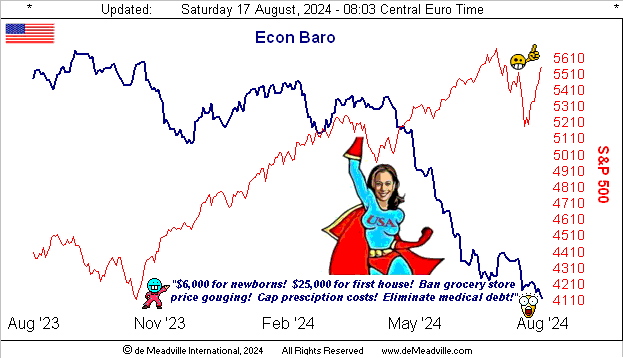
Of the 19 metrics that came into the Baro this past week, ten were worse period-over-period: thus nine improved. But prior-period revisions hurt the overall performance of the mix, and down it went. Our sense clearly is that most folks (including vaunted economic analysts) don’t see how poorly the economy is performing, (i.e. we actually do the math). Amongst the “out to lunch bunch” came Dow Jones Newswires this past Thursday with “S&P 500 erases August losses as ‘irrational recession fears’ fade.” But the day is lurking where ’twill suddenly whack ’em over the head and the U.S. shall once again regress. Fortunately, however, per the above graphic: folks stand to get all that “free stuff!” And as just noted by DJNw, just look at that stock market go up! Life is great in the Investing Age of Stoopid.
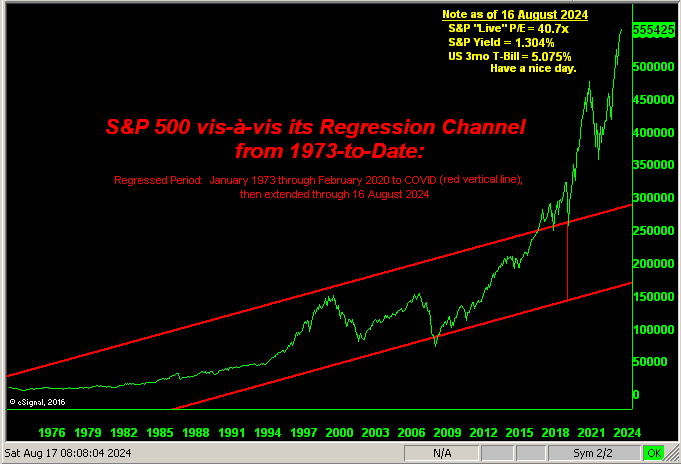
Such statement bears our updating the following chart of the S&P 500 from better than 50 years ago-to-date. You regular readers know the drill here: the regression channel is based on the track of the S&P up to COVID’s arrival in March 2020 (vertical red bar), from which the channel is then extrapolated through now. But came the Fed’s $6.9T infusion, all of which — as we’ve previously herein “proven” — basically found its way into the S&P 500. Remember: sans COVID, by the regression channel, the S&P would today be ’round 3000 and all therein invested would be happy as a clam. Instead, we’ve the S&P’s “live” price/earnings ratio as shown at 40.7x versus its inception reading (in January 2013) of 25.4x. Thus earnings indubitably haven’t kept pace with price. And with the S&P today at 5554, to revert to such inception reading (which is inevitable upon it all going wrong) ‘twould place the Index down to 3466:
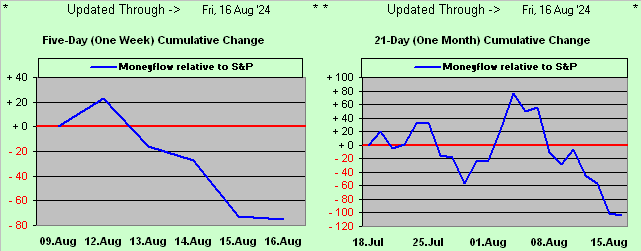
Don’t think ’twill happen? Look how weak the S&P’s recent “recovery rally” is from our MoneyFlow page. “That can’t be good…”
“Or, mmb, earnings have to really take off…“
But hardly are they, Squire. Indeed yesterday concluded Q2 Earnings Season. For the S&P 500: of the 433 constituents having reported, the good news is 70% of them bettered their bottom lines from a year ago, ranking the quarter as 10th best for individual constituent improvement from as far back as 2017. Yet, the bad news is to get the P/E back down to 25.4x, earnings (cap-weighted to be consistent) need grow at an annualized 60% pace. What was the pace for just completed Q2? 19%. That’s it, (excluding 10 constituents that lost money). But you still can get an annualized 5% risk-free pace from the three-month U.S. T-Bill. Think about that.
Better still, think about Gold having just made a fresh All-Time High. And notwithstanding near-term price reversion, one senses there are further levels up the Gold road with better than four months for this year remaining to unfold. Too, there is so much on the table including uncertainties about global instability, StateSide politics, the endlessly overvalued stock market, and tons of $Trillions in debt due to be paid “Old Yeller’s” U.S. Treasury. “Got Gold?”
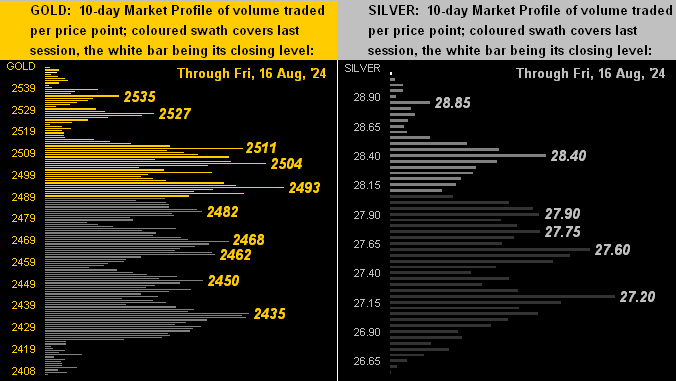
But as we turn to the daily bars for the last three months of Gold on the left and Silver on the right, their correlation has morphed from positive to negative. Indeed Sister Silver has suffered from casting off her precious metal pinstripes and donning her industrial metal jacket so as to hang with Cousin Copper, of whom as we noted a week ago has collapsed some -21% within the past three months, (see our Copper page). Thus we’ve Gold at an All-Time High … but Silver (now 29.09) is an unconscionable -42% below her best level of 49.82 (25 April 2011) You shan’t forget Sister Silver, shall you…
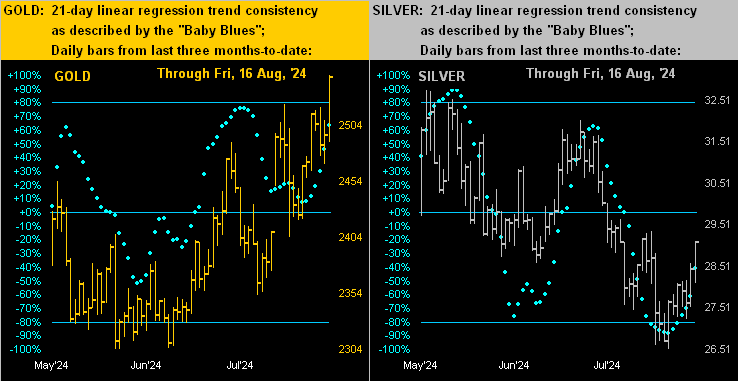
However by their 10-day Market Profiles, both Gold (below left) and Silver (below right) are at the top of their games with lots of lovely support levels as labeled:
Let’s therefore wrap with the stack:
The Gold Stack
Gold’s Value per Dollar Debasement, (from our opening “Scoreboard”): 3707
Gold’s All-Time Intra-Day High: 2548 (16 August 2024)
2024’s High: 2548 (16 August 2024)
10-Session directional range: up to 2548 (from 2406) = +142 points or +5.9%
Gold’s All-Time Closing High: 2546 (16 August 2024)
Trading Resistance: none per the Profile 2341
Gold Currently: 2546, (expected daily trading range [“EDTR”]: 43 points)
Trading Support: various per the Profile, but notably the 2511-2493 range
10-Session “volume-weighted” average price magnet: 2473
The Weekly Parabolic Price to flip Short: 2339
The 300-Day Moving Average: 2121 and rising
The 2000’s Triple-Top: 2089 (07 Aug ’20); 2079 (08 Mar’22); 2085 (04 May ’23)
2024’s Low: 1996 (14 February)
The Gateway to 2000: 1900+
The Final Frontier: 1800-1900
The Northern Front: 1800-1750
On Maneuvers: 1750-1579
The Floor: 1579-1466
Le Sous-sol: Sub-1466
The Support Shelf: 1454-1434
Base Camp: 1377
The 1360s Double-Top: 1369 in Apr ’18 preceded by 1362 in Sep ’17
Neverland: The Whiny 1290s
The Box: 1280-1240
Following this past week’s onslaught of incoming economic data, that for next week is fairly subdued, highlighted on Monday (19 August) by The Conference Board’s lagging indicator of “Leading Indicators”, which quite rightly (duh!) will be a negative reading, given our Baro is leading. Otherwise fundamentally, there’s so much on the plate, so much can change!
So hang on to your change given more Gold highs within range!
Cheers!
…m…
More By This Author:
Hilarious Herd Hysteria, Gold Holds Its Own
Gold Makes A FATH - Stocks Take A Bath
Gold Gets Gut-Punched … Again


Comments
Log in or sign up to join the conversation.