


Let’s start with stocks, notably citing the hilarity of the FinMedia & Herd hysteria. Not that we need be reminded, however this past Monday’s (05 August) selling underscored the stock market’s otherwise quintessential condition of complacency since any or all of the following stages (make your choice), courtesy of the “We Never Go Down Dept.”:
- Initial expectations during October 2023 that the Federal Reserve must cut rates (even as they’ve yet to so do) … but the market zoomed higher,
- Digesting during October 2022 the RUS/UKR incursion as by then having become an endless, ongoing normal part of life … so the market zoomed higher,
- COVID from March 2020 having resulted in the Fed’s “creation” of ultimately $6.2T (+39%), which we’ve on occasion mathematically demonstrated “all” ended up in the S&P 500 … i.e. the market zoomed higher.
Indeed from the S&P’s COVID bottom at 2192 on 23 March 2020, the mighty index has increased by as much as +159% to 5670 on just this past 16 July.
But specific to our point about Monday — because the S&P impossibly dropped a net -3.0% in just that one day — the FinMedia & Herd went hilariously hysterical! And in this ongoing context of The Investing Age of Stoopid, oh how those world-ending FinMedia headlines had us rolling in the aisles!
- Business Standard: “Stock Market Crash“,
- Fortune: “Share price bloodbath“,
- CNEWS: “Les actions en chute mortelle” (stocks in fatal fall),
- CNBC: Per Chicago FedPrez Austan “The Gools” Goolsbee on if (IF?) the economy deteriorates, the Fed will “fix it”,
- Bloomy: “Traders ramp up bets that the Federal Reserve will step in with an emergency interest rate cut”,
- Et alia “ad infinitum”.
Now here’s the really hilarious part… Ready?
Monday’s stock market “carnage” was the 92nd (“ninety-second”) worst net trading day for the S&P 500 thus far this century. What that means for you WestPalmBeachers down there is that from 02 January 2001, there already had been 91 days that were worse for the S&P than Monday’s -3.0% net drop (intra-day low -4.3%). By comparative honesty ’twas thus nothing more than “noise”, especially per the following logarithmic chart of the S&P century-to-date. The red line denotes the lowest to where the S&P reached (5119) last Monday. And yet, ’twas “World Ends!” per the red arrow:

To be sure, the whole FinMedia & Herd insanity emphasizes the parroting that passes sadly for “informative news”, (which is why some three decades ago we stopped watching “CNBS”, et alia). The optics are that news entities no longer do the math, rather they just follow right along with competing agencies’ reports whist trying to outdo each other’s adjectives. Hence our presentation of the above chart. And given that correct perspective, “The Sell” obviously was nothing, and further, the S&P has come all the way back up to the “pre-disaster” level, toward settling yesterday (Friday) at 5344. But as noted in the chart, the circuit breaker “limit-down” days are coming. Ensure you’ve plenty of popcorn to enjoy that FinMedia & Herd meltdown.
As to the current state of the S&P 500:
- ‘Tis now 12 days “textbook oversold”, although just mildly so,
- With a week to run in Q2 Earnings Season, 70% of companies have bettered their year-ago bottom lines, which is an above-average pace,
- But the Index’s albatross ’round the neck remains its exceedingly high “live” price/earnings ratio, now 38.6x — with risk-free money still paying 5% — should you care to do the math:

“““Whoomp! (There It Is)”
–[Tag Team, ’93]).
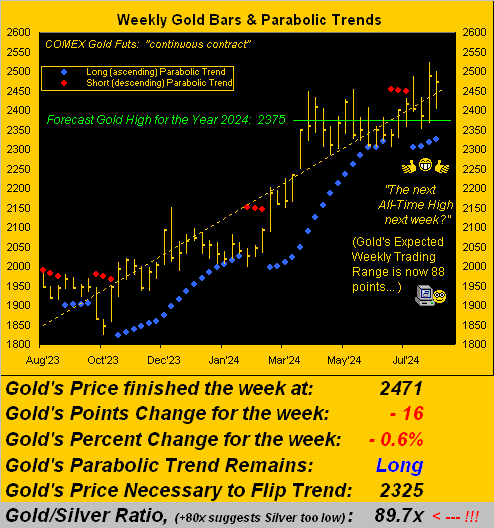
Returning to sanity, here is Gold per its chart of weekly bars and parabolic trends from one year ago-to-date. Whilst ’tis holding its area, yes, in Thursday’s (08 August) Prescient Commentary we penned: “…Gold’s daily MACD is provisionally crossing to negative: per the current Market Rhythms list, that study for the yellow metal has profited by at least $2,600/cac (regardless of signaling Long or Short) for nine of the past 10 such crossovers…” ‘Tis why we stated “provisionally”, for by Gold’s continuous futures contract, the negative MACD (moving average convergence divergence) crossover did not (at least yet) confirm. Either way, as below depicted, Gold is well within range for a fresh All-Time High (above 2538 basis December) in the new week:
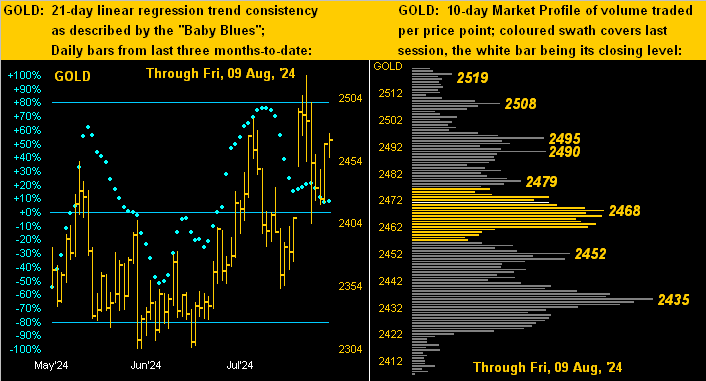
Further drilling down into “The Now” for Gold, here next is our two-panel graphic of price’s daily bars from three months ago-to-date on the left and 10-day Market Profile on the right. The premium gap from some eight trading days ago has since filled, albeit the baby blue dots of trend consistency are rather erratic. As for Gold’s Profile (all December contract data), the pricing field remains significantly congested, the more notable volume supporters and resistors as labeled:
But in turning to same for Silver, the bad news clearly is her pricing track (below left) being far more feeble than that for Gold, (yes, blame it to an extent on collapsing Copper which from 20 May to yesterday’s settle has dropped -21%). Yet therein, the good news is Silver’s “Baby Blues” are poised to curl up above her -80% axis, which as you website enthusiasts know is an outright (given prudent cash management) “Buy” signal. Too, per the aforeshown graphic of Gold’s weekly bars, the Gold/Silver ratio is still historically high at 89.7x: adjusted to the century-to-date average (now 68.4x), rather than priced today at 27.50, Sister Silver would instead be +31% above that at 36.14 … just in case you’re scoring at home. However, her Profile (below right) is similarly congested to that of Gold:

‘Course, the week would not be complete without the state of the Economic Barometer, which plainly is not good.
“Dare you instead say ‘stateless’, mmb?“
Nearly so there, Squire, our having had to rescale lower the Econ Baro’s axis (which we numerically never reveal, lest the world indeed truly end). Regardless, ’tis ever so bleak. However, the Baro’s saving grace is — its mathematically being an oscillator — that it can move upward as “things get worse more slowly” (to reprise Krugman from back in ’01). And whilst this past week was very muted for incoming metrics (just five arrived), next week brings 18 reports for the Baro, which of course we update by the day per the website. Again cue the BeaTles with “““Now and Then”
–[’23]).

That’s right, Gools, you tell ’em, baby! To which we wrap with rates.
As you valued regular readers know, given the Baro’s blow, we’ve been knowledgeably ahead of the deteriorating curve of the economy for better than three months now. Admittedly, earlier in the year given the non-cessation of inflation, we mused over the Fed perhaps having to actually raise its rates. But the with the economy’s demise in front of our eyes, through many a recent missive we’ve stated that the Fed must cut. However, come the Open Market Committee’s Policy Statement just on 31 July, the Fed stood pat. But then the stock market made its wee crack, and all of a sudden, FinMedia & Herd are proclaiming ’tis not just that the Fed must cut, but indeed so do now as an “emergency” measure, and moreover that it be a “double cut”.
“Well, mmb, a lot has happened in the last week and a half…“
Or better stated, dear Squire, nothing recently has happened because it already had happened. ‘Tis just that the FinMedia & Herd & Fed are all behind the curve.
But don’t you get thrown a hysteria curve…

…rather with Gold maintain your verve!
Cheers!
…m…
More By This Author:
Gold Makes A FATH - Stocks Take A BathGold Gets Gut-Punched … Again
Another Gold Pop N’ Flop

Comments
Log in or sign up to join the conversation.