
Upon Gold’s record run this past Tuesday into Wednesday’s fresh All-Time High of 2488, we gave pensive consideration to entitling this week’s piece as “The Joy of Being Wrong”.
After all, given Gold’s recent weekly technicals having been imbued with a rather negative bent, we’ve been prudently wary of a run down to test our oft-mentioned 2247-2171 structural support zone.
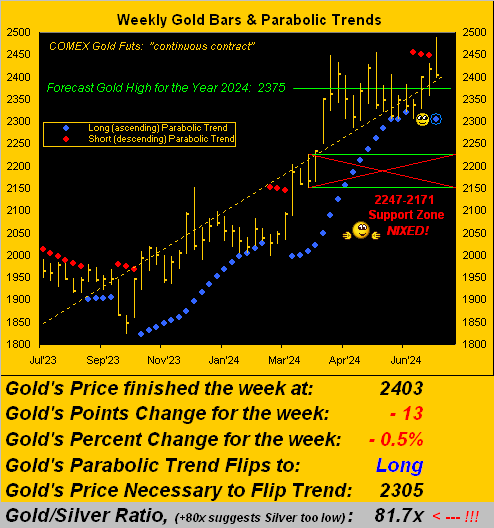
Not to beat up on ourselves too much, for the prior two weekly missives have pointed to Gold’s positive fundamentals admirably gaining more sway than the negative technicals. And we were instinctively joyous at the metal’s new high given the positives — at least for a moment — having won out over the negatives. For come that new 2488 All-Time High, Gold had once again proved its pop … only to flop in the balance of the week, price settling yesterday (Friday) at 2403 for a net weekly loss (despite the new record high) of -13 points (-0.5%) … worse within which was a high (2488)-to-low (2396) drop of -92 points (-3.9%).
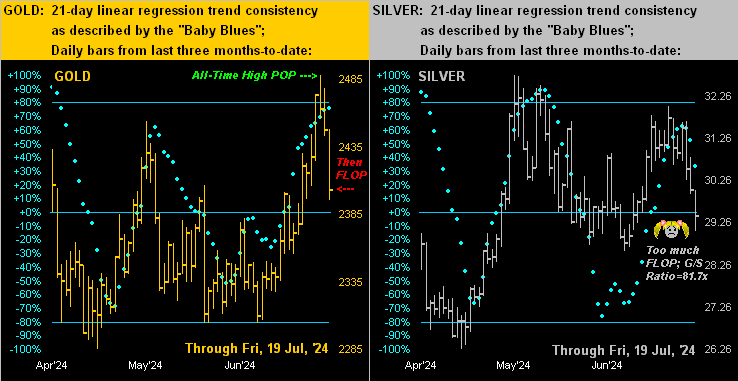
To wit, let’s straightaway start with our two-panel graphic of daily bars for the past three months-to-date for Gold on the left and for Silver on the right. With both precious metals, the rightmost three bars show the story, Silver suffering the worse of the two by the Gold/Silver ratio rising back above 80x to now 81.7x: poor ol’ Sister Silver!
As to Gold, call it a “bad news All-Time High” with which however comes a “good news parabolic flip to Long”. The “bad news” is of course Gold yet again swiftly dropping following the new record high, similarly as we twice saw during last Spring’s “double top”. Regardless, the “good news” per the encircled dot below in blue is the parabolic trend flipping to Long despite the down week, suggesting one can grab more Gold ’round here on the cheap should price “expectedly” zoom right back up again. Therein note (and arguably prematurely) we’ve nixed the 2247-2171 structural support zone. Indeed specific to Gold’s brand new parabolic Long trend, its “flip to Short” level beginning at 2305 is essentially at the base of price’s trading range across the past 15 weeks:
To be sure, all five primary BEGOS Markets (Bond / Euro / Gold / Oil / S&P 500) netted losses for the past week, (the latter deservedly so given its ongoing massive overvaluation sans earnings support; but Stoopid shan’t sell until far lower still).
Digression aside, what really pops out in the above graphic is Gold’s last three red-dotted parabolic Short trends all having respectively lasted just three weeks apiece. That’s Gold Power!
Sufficiently intriguing is this notion such that we decided to pull together the following chart of “parabolic performance” by cumulative weekly duration for each of Gold’s last ten Long and Short trends. And as stated: when the blue line is rising, watch for Gold to be trending upward, else when the red line is rising, watch for Gold to be trending downward. (Obviously for you WestPalmBeachers down there, when one line is rising, the other line stays flat). This is why we emphasize the state of Gold’s weekly parabolic trend in every one of these missives. For ’tis nice to “know” which way Gold is gonna go; (just don’t forget the cash management should the “know” turn out as “no”). And therein you can see the recent dominance of the blue Long line breaking higher:
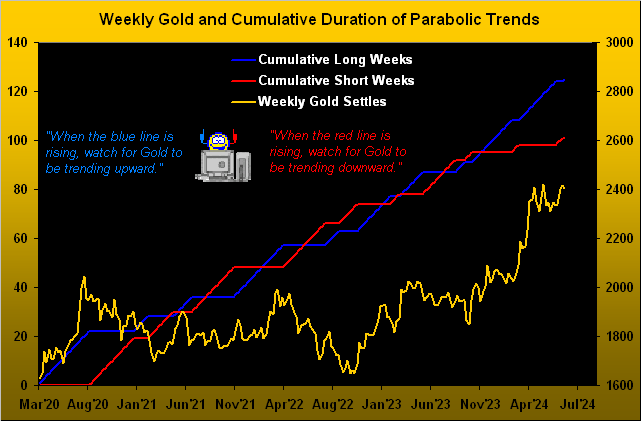
Therefore, despite Gold having taken a bit of a blow for the week, the fresh parabolic Long trend “ought” see yet another All-Time-High, shall we say, “sooner than later”. Across the past ten Long stints, the “median maximum” price increase for Gold is +6.5%, which (in that vacuum) from here would bring 2559, a nice leap above the latest All-Time High of 2488, (just in case you’re scoring at home).
As to the StateSide Economic Barometer, ‘twas finally afforded at least some leap. But for the week’s 14 reports issued, period-over-period, seven improved and seven were worse. Still, the Baro did turn upward, which – because ‘tis an oscillator rather than a pure index – can occur as “things are getting worse more slowly” –[Paul “The Notorious” Krugman, 2001].
A distinct element therein was the Conference Board’s disclosure of so-called “Leading Indicators” for June, (to which you regular readers know we refer to as “lagging” given the Econ Baro is always well ahead of said stead). And as anticipated given the Baro’s having been comprehensively boffed these recent months, such “Indicators” shrank at a -0.2% pace. But that was an improvement over the May shrinkage of -0.4%.
“So things then are getting worse more slowly, eh mmb?“
Squire, not to throw the baby (or in this case the Baro) out with the bathwater, there were some positives, notably for June’s ex-auto Retail Sales, Housing Starts and Permits, Capacity Utilization, and July’s Philly Fed Index. In fact, the latter (after being a lowly 1.3 in June) reached 13.9, its best level since that for April, and thus in turn, its second-best reading in the past 26 months.
But to the extent such Baro bounce continues, the new week’s set of 10 key incoming metrics includes the first peek at Q2 Gross Domestic Product: might it actually be negative given the Baro’s broad-based break-down? The consensus for +1.9% seems a bit optimistic. Too, to round out June’s inflation data comes the “Fed-favoured” Core Personal Consumption Expenditures Price Index. Does the Federal Reserve’s Open Market Committee vote on 31 July to reduce The Bank’s lending rate? The on-balance plunging Baro suggests “yes”, but as we’ve quipped, we don’t think the behind-the-curve Fed actually sees it. Yet, maybe the International Monetary Fund does, (hat-tip New York Times from last Tuesday): “I.M.F. Sees Signs of Cooling in U.S. Economy“ At least one entity is paying attention. En tous cas, on verra… (a little French lingo there).
As for the “deviation” comment in the graphic, will the Baro one day return to directionally leading the S&P 500 as it used to so do for some 22 years pre-COVID? Here’s the year-over-year view:
Also note a wee bit of correction by the S&P 500 (the red line), the Index finally seeing some selling after having been “textbook overbought” for 28 consecutive trading days. At present, the honestly calculated, “live” price/earnings ratio of the S&P is 41.2x: that is a +62% increase from its inception in January 2013, meaning (obviously) hardly have earnings kept pace. Indeed, with Q2 Earnings Season underway, of the 52 S&P 500 constituents having thus far reported, just 65% have improved their year-over-year bottom lines; (but 88% have beaten the sneaky investment bankers’ magic trick known as “estimates”, so ’tis all good, right?). Got Gold?
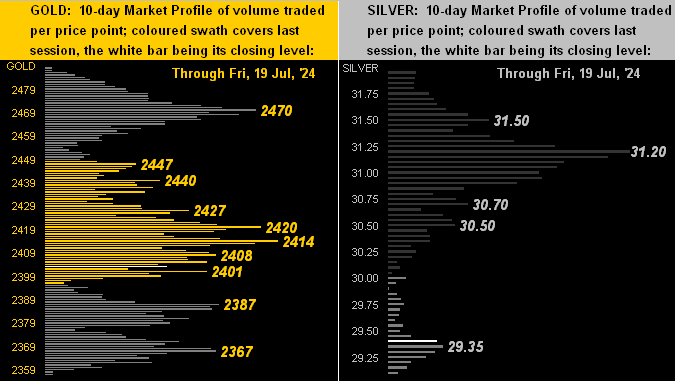
Here’s Gold (below left) by its 10-day Market Profile, along with that for Silver (below right). We’ve mentioned of late the “conflict” between the yellow metal’s positive fundamentals and recent negative technicals, and ’tis exemplified in the Profile as no one trading area is overwhelming dominant. And even as Gold’s weekly parabolic trend now is officially Long, the MACD (moving average convergence divergence) remains Short through a sixth consecutive week. Whereas for Sister Silver, the white metal’s 31.20 level had well been her home over the past fortnight until this week’s late selling became her plight:
Now prior to our wrap ’round CRWD’s MSFT update trap, here next we’ve the stack:
The Gold Stack
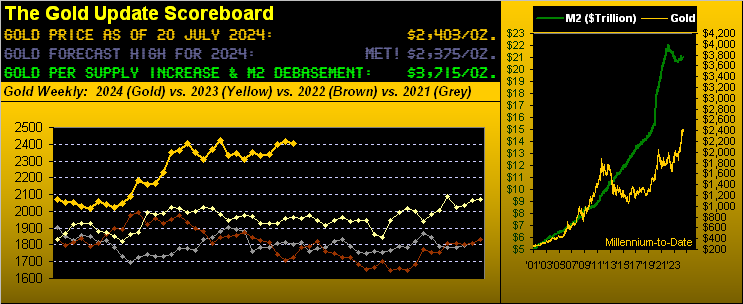
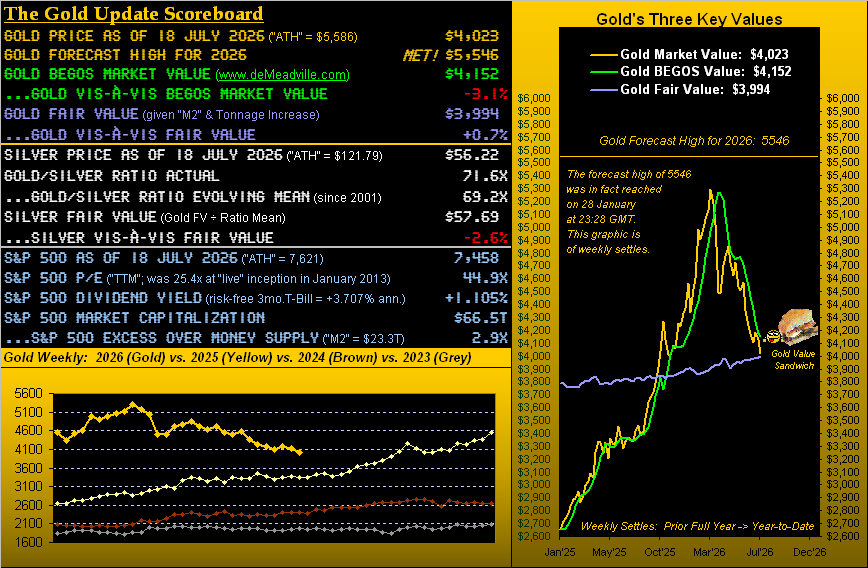
Gold’s Value per Dollar Debasement, (from our opening “Scoreboard”): 3715
Gold’s All-Time Intra-Day High: 2488 (17 July 2024)
2024’s High: 2488 (17 July 2024)
10-Session directional range: up to 2488 (from 2357) = +131 points or +5.6%
Gold’s All-Time Closing High: 2474 (16 July 2024)
10-Session “volume-weighted” average price magnet: 2420
Trading Resistance: notables per the Profile 2414 / 2420 / 2470 2341
Gold Currently: 2403, (expected daily trading range [“EDTR”]: 36 points)
Trading Support: notables per the Profile 2401 / 2387 / 2367
The Weekly Parabolic Price to flip Short: 2305
The 300-Day Moving Average: 2090 and rising
The 2000’s Triple-Top: 2089 (07 Aug ’20); 2079 (08 Mar’22); 2085 (04 May ’23)
2024’s Low: 1996 (14 February)
The Gateway to 2000: 1900+
The Final Frontier: 1800-1900
The Northern Front: 1800-1750
On Maneuvers: 1750-1579
The Floor: 1579-1466
Le Sous-sol: Sub-1466
The Support Shelf: 1454-1434
Base Camp: 1377
The 1360s Double-Top: 1369 in Apr ’18 preceded by 1362 in Sep ’17
Neverland: The Whiny 1290s
The Box: 1280-1240
Wrap warning: do not read the following whilst drinking, lest — in a fit of laughter — the liquid spout from your nose.
“Everybody everywhere” is aware of yesterday’s CrowdStrike security update that rendered useless many a Microsoft (et alia) platform. (Indeed, we were directly affected, a trading algorithm firing off a S&P futures Short signal, but the code was unable to connect to the broker … ““Mama said there’ll be days like this” ”
–[The Shirelles, ’61]).
But to our point: shares of CRWD took an -11% Friday tumble. Yet when briefly visiting MSFT’s “Bing” search engine, it therein displayed for CRWD the following snippet, appropriately annotated with our red ink (put your glass down):
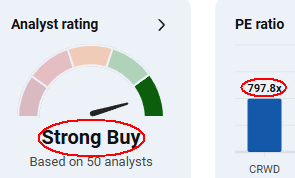
Honestly: who on earth pays $797 for something that earns $1? And yet ’tis a “Strong Buy”?? Is it any wonder we regularly refer to this as the Investing Age of Stoopid???
‘Tis immeasurably better to pay 2403 for something worth (by our opening Scoreboard) 3715: GOLD!
Cheers!
…m…
More By This Author:
Gold Gives Thanks As The Economy Tanks
Gold Fundamentally Seeking Grip, Technically Still Facing Dip
Inflation’s Strain Remains Gold’s Bane

Comments
Log in or sign up to join the conversation.