GDP, GDP+, And GDO(?) For Q4

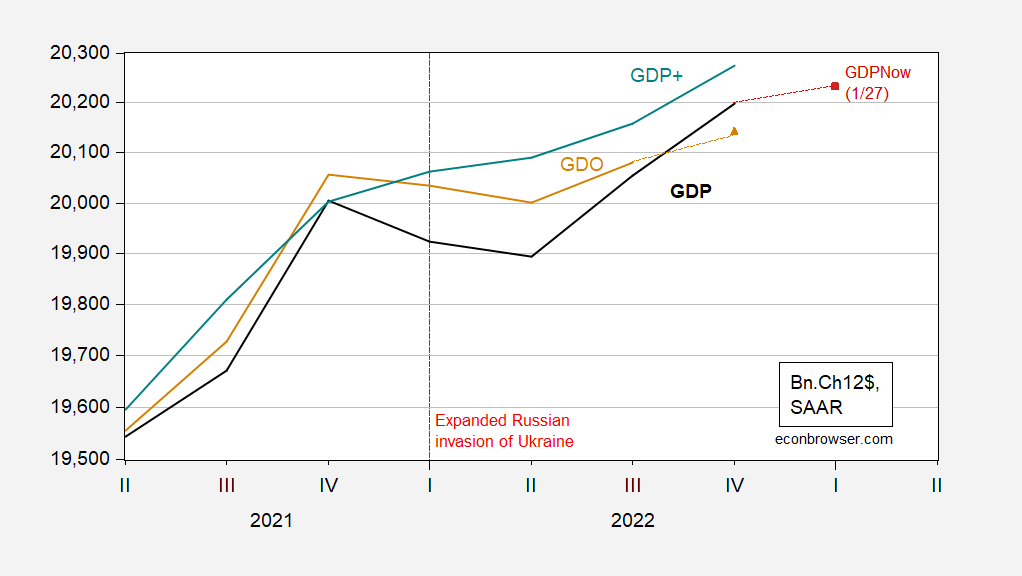
According to some aggregate measure, there was a slowdown in 2022H1, but GDP+ says not.
Figure 1: GDP (black), GDPNow of 1/27 (red square), GDO (tan), GDO estimate for Q4 (tan triangle), GDP+ (teal), all in billions Ch.2012$ SAAR. 2022Q4 GDO based on GDI where net operating surplus set to equal 2021Q3 value. GDP+ level calculated by iterating growth rates on 2019Q4 actual GDP. Source: BEA, 2022Q4 advance, Atlanta Fed, Philadelphia Fed, and author’s calculations.
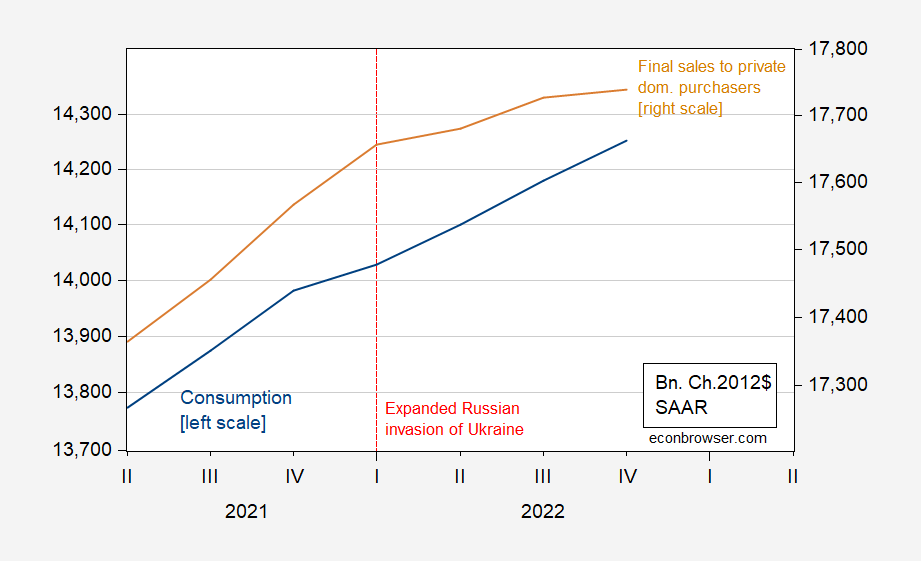
While GDP and GDO declined in H1, it’s interesting that neither final sales to private domestic purchasers and consumption declined.
Figure 2: Consumption (blue, left scale), and final sales to private domestic purchasers (tan, right scale), all in bn. Ch.2012$ SAAR. Source: BEA 2022Q4 advance release.
In every (NBER-defined) recessions since 1967, final sales always fell. Consumption too, with the exception of the 2001 recession (the WSJ January survey median response indicates the recession begins in 2023Q1, contra GDPNow as of 1/27). In other words, it does not appear the recession is here yet; nor does it appear that there was a recession in 2022H1 given the previous, employment trends, and the Sahm rule (contra Kopits).
More By This Author:
Business Cycle Indicators As Of End-January 2023 And Q1 NowcastsFed Hasn’t Stopped GDP From Growing
Instantaneous Inflation
Disclosure: None.


