
Fundamentally Speaking: Earnings Don’t Support Bullish Thesis
With the second quarter of the 2020 reporting season mostly behind us, and with markets testing “all-time” highs, do earnings support the bullish thesis? Such is the fundamental question surrounding the debate over the record deviation between “momentum” and “growth.”
No Real Surprise
As we stated before the earnings season began, the annual “beat the estimate” game would, as always, have a high “beat rate.”
“SO EXCITED! – It’s almost Millennial Soccer season on Wall Street where companies begin to beat estimates on drastically lowered expectations.”
Why do I call it “Millennial Soccer” season? As I explained in “The Truth About Wall Street Analysis.”
Earnings season is now a ‘game’ where no one keeps score. The media cheers, and everyone gets a ‘participation trophy’ just for showing up.”
Not surprisingly, after cutting earnings estimates drastically following the first quarter, companies reported a record “beat” rate.
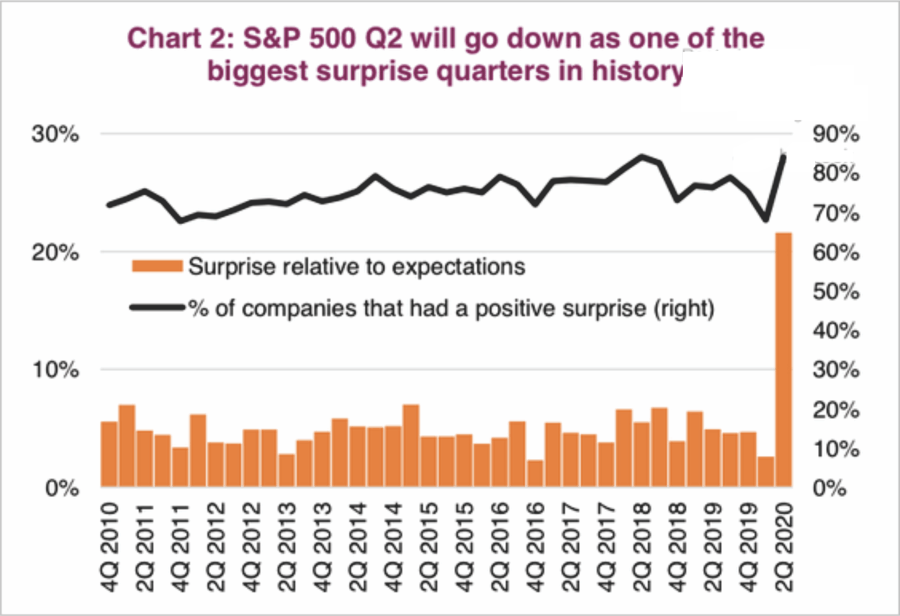
With 90% of companies reporting, we can safely say – “everyone got a trophy.”
Such a high “beat rate” certainly “seems” to suggest companies are firing on all cylinders, and that currently elevated prices are justified.
However, as they say, the “Devil is in the details.”
Upward Revisions Not What They Seem
Let’s start with the “estimate revisions,” which have been touted by the bulls as clear evidence of support for lofty valuations. The chart below is the “revision breadth” by analysts for the S&P 500.
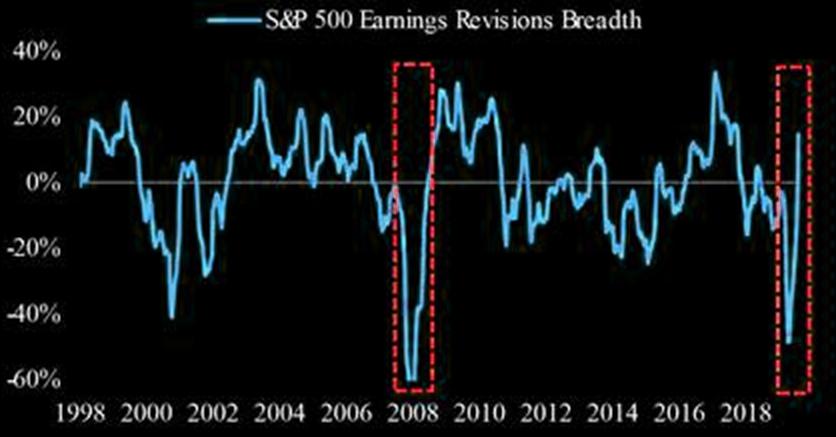
While these revisions from extremely negative levels are significant, and investors rush to chase extremely overvalued “momentum stocks,” the overall “earnings season” was quite dismal. As noted by FactSet:
“Earnings Growth: For Q2 2020, the blended earnings decline for the S&P 500 is -33.8%. If -33.8% is the actual decline for the quarter, it will mark the largest year-over-year decline in earnings reported by the index since Q1 2009 (-35.4%).
Earnings Guidance: For Q3 2020, 11 S&P 500 companies have issued negative EPS guidance and 34 S&P 500 companies have issued positive EPS guidance. (Only 10% issued guidance, which leaves analysts guessing at future results)
Valuation: The forward 12-month P/E ratio for the S&P 500 is 22.3. This P/E ratio is above the 5-year average (17.0) and above the 10-year average (15.3).
Pay very close attention to the chart below.
Paying More For Less
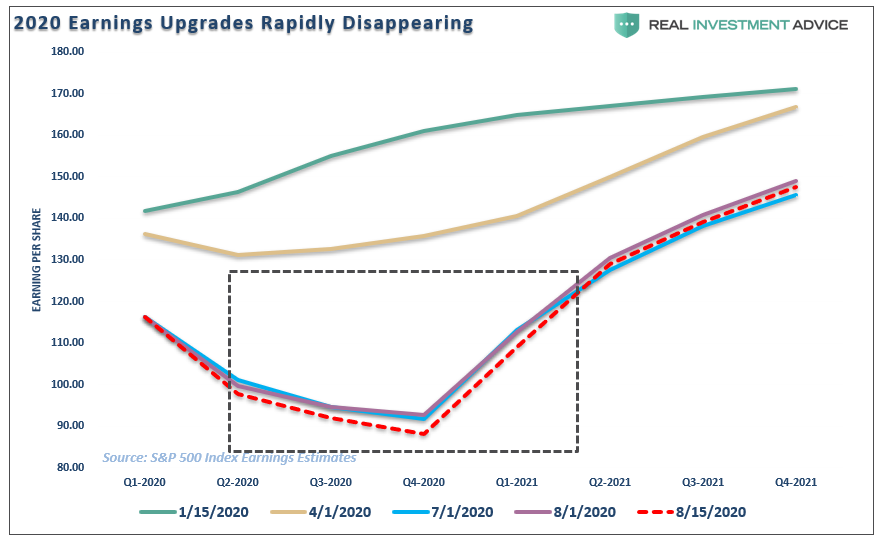
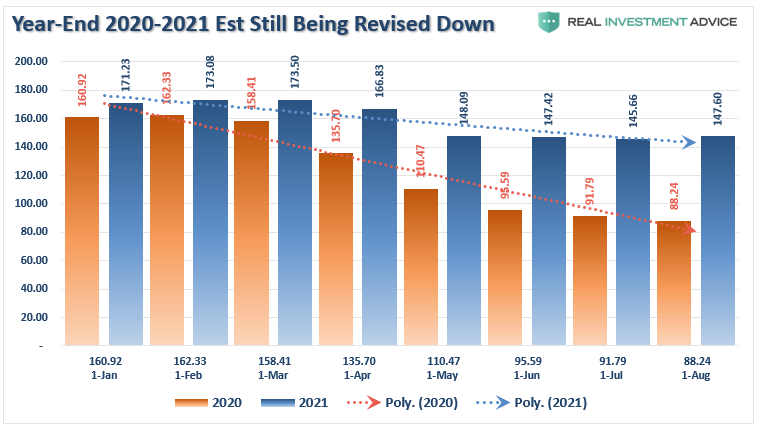
Below is the evolution of estimates from Standard & Poors from the beginning of this year.
(Click on image to enlarge)
Let me point out some critical points:
- In January and February, investors were bidding up stocks to all-time highs based on REPORTED earnings of $171/share by the end of 2021.
- Today investors are paying the same price for 2021 earnings that are $20/share lower.
- While earnings revisions did tick HIGHER at the beginning of August, estimates through the end of 2020 hit a new low just 2-weeks later.
The message here is simple.
- In January of 2020, investors were told to buy stocks because valuations were cheap based on 2021 estimates.
- In August of 2020, investors are being told the same, but they are paying more for less.
But what about those upward revisions?
Estimate Revisions Are Small
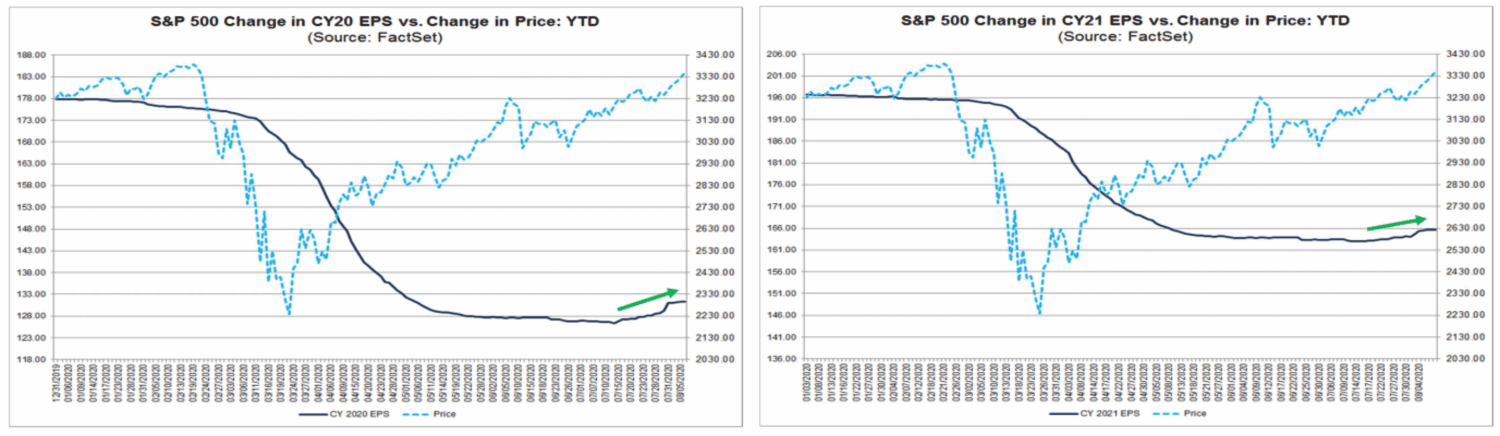
Look at the chart above again. You will notice there have indeed been upward revisions to estimates through the end of the year. However, they have been tiny relative to the increase in asset prices. FactSet also made a note:
“During the first six months of CY 2020, analysts lowered earnings estimates for companies in the S&P 500 for the year. The CY 2020 bottom-up EPS estimate (which is an aggregation of the median 2020 EPS estimates for all the companies in the index) declined by 28.7% (to $126.86 from $177.81) during this period.
This marked the largest decrease in the annual EPS estimate for the index over the first six months of the year since FactSet began tracking the annual bottom-up EPS estimate in 1996.
Not surprisingly, given the record-level cuts to EPS estimates during the first half of the year, it resulted in the elevated “beat rate” as noted above. Given the high beat rate, analysts are confident in increasing their estimates for the next quarter.
Since June 30, the CY 2020 bottom-up EPS estimate has increased by 3.5% (to $131.30 from $126.86).”
(Click on image to enlarge)
Not so impressive when viewed at this level. However, the charts below show the evolution a little more clearly. The data below is the latest from Standard & Poors for the S&P 500 index.
Just A Nudge
Let’s start with the monthly changes since January. You will notice that 2020 estimates are lower, while 2021 estimates are slightly increased. Not so impressive.
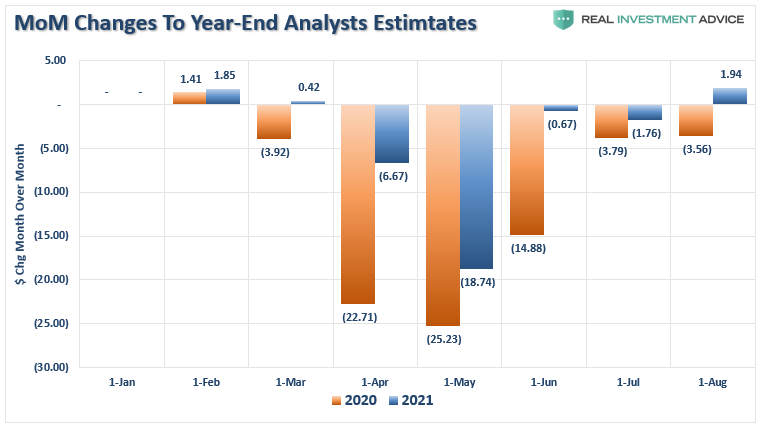
However, that chart is deceptive, along with the FactSet data. The reality is that while markets are sitting at all-time highs (as they were in February), both 2020 and 2021 estimates are lower.
“Price is what you pay, value is what you get.” – Warren Buffett
An Earnings Reality
But this is where you should take notice.
During the last TWO years, reported earnings for the S&P 500 have plunged. While analysts are currently hoping for a “V-shaped” economic recovery to provide for the “hockey stick” recovery, risks are high such will not occur.

As noted, investors are currently “paying up” for 2021 earnings, which are $27 lower than 2020 earnings in April 2019.
The reality is that earnings, and more importantly, revenue (which is where earnings come from) have collapsed.
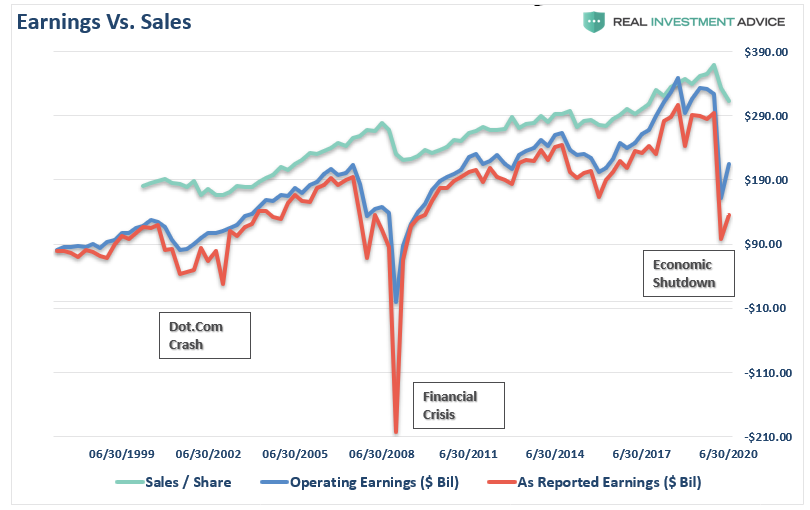
The chart below shows the total cumulative growth of the S&P 500 index versus operating (most optimistic as its earnings before all the bad stuff) and sales per share.
Do you see the problem here?
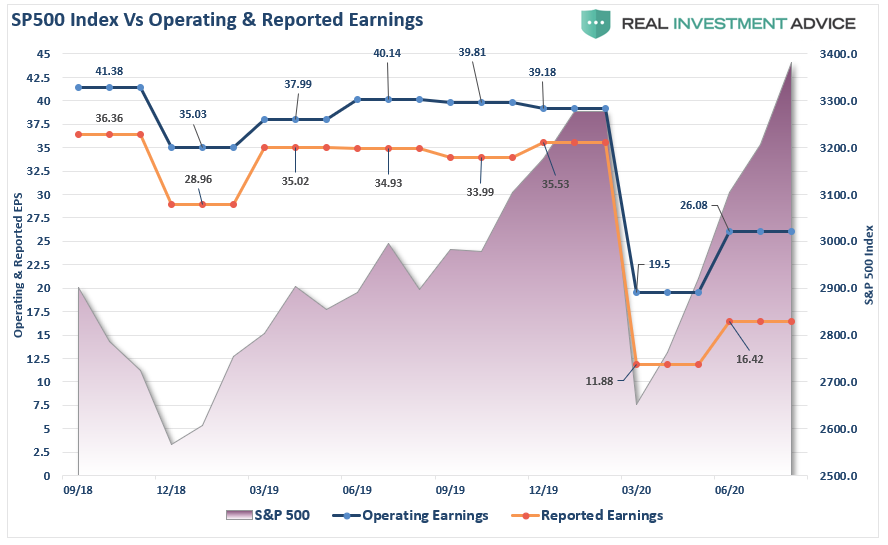
Here is a better way to visualize the disparity. The chart below shows the S&P 500 index versus both Operating (fantasy) and Reported (reality) earnings.
Even with the recent upward revisions to earnings, operating earnings are still 33% lower, with reported earnings down 46%.
It’s Actually Worse
Despite the rise in the S&P 500 index, earnings have fallen despite substantially lower tax rates and massive corporate share repurchases. (Share repurchases reduce the denominator of the EPS calculation.)
Such is no small thing. The issue of share repurchases previously has been two-fold. Primarily, it was the distortion of bottom-line earnings per share.
We have discussed the issue of “share buybacks” numerous times and the distortion caused by the use of corporate cash to lower shares outstanding to increase earnings per share.
‘The reason companies spend billions on buybacks is to increase bottom-line earnings per share, which provides the ‘illusion’ of increasing profitability to support higher share prices. Since revenue growth has remained extremely weak since the financial crisis, companies have become dependent on inflating earnings on a ‘per share’ basis by reducing the denominator. “
At the end of 2019, reported EPS was boosted by $3.21/share by share buybacks. That support has now collapsed to just $1.51 per share.
(Click on image to enlarge)
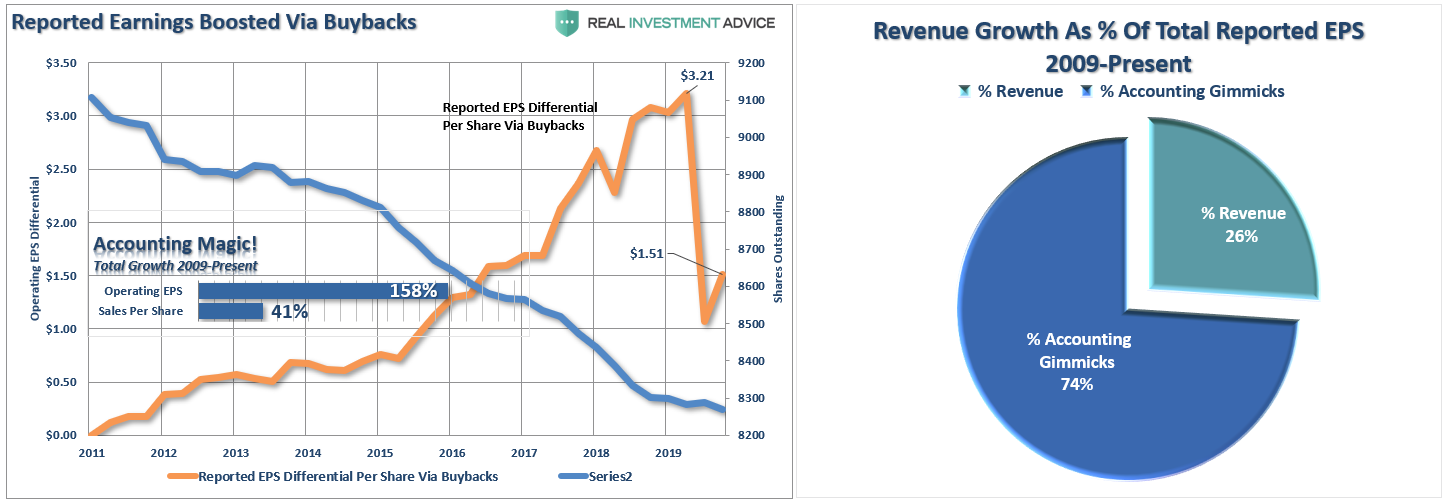
Importantly, note that while shares outstanding have reached a new low, earnings have collapsed as well. However, had it not been for the share repurchases, the EPS decline would have been worse. Nearly 75% of earnings reported are from “accounting gimmickry” versus actual “revenue” growth.
Think about that for a moment.
Buyback Support Is Fading
Secondly, a rising headwind for markets in the future will be to share buybacks to remain a significant market support.
As noted previously,
However, for investors, the real issue is that almost 100% of the net purchases of equities has come from corporations.
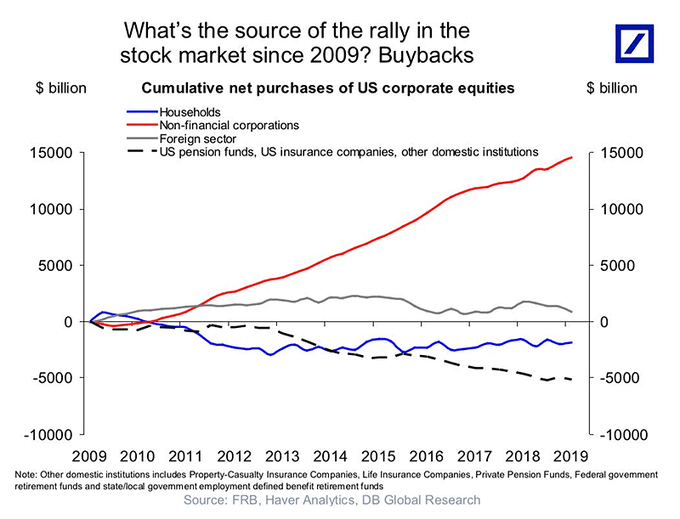
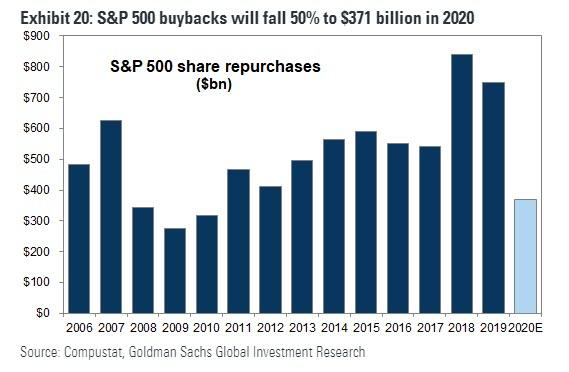
Today, buybacks have fallen sharply as corporations move to conserve cash amidst a recessionary economy.
As noted, since the “Financial Crisis” lows, much of the rise in “profitability” has come from cost-cutting measures and accounting gimmicks rather than actual increases in top-line revenue. While tax cuts certainly provided the capital for a surge in buybacks, revenue growth, which is connected to a consumption-based economy, remained muted. Now, the “economic shutdown” has crushed revenue growth entirely.
Since 2009, the operating earnings per share of corporations has risen by just 158%. However, the increase in earnings did not come from an increase in revenue. During the period, sales (which is boosted due share reductions) grew by a marginal 41%.
However, investors have bid up the market more than 365% from the financial crisis lows of 666.
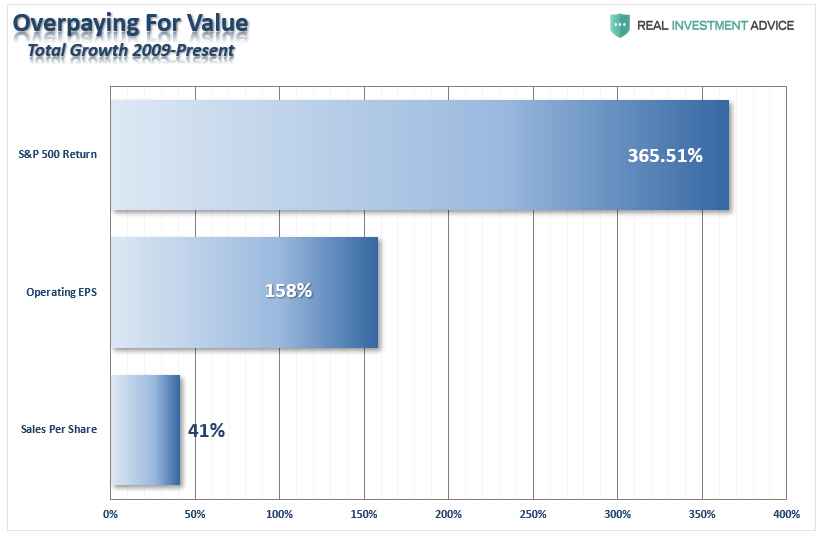
Investors are once again extremely optimistic they haven’t overpaid for assets.
A Narrow Exit
While Wall Street continues to come up with a myriad of ways to “rationalize” overpaying for assets in the markets currently, just remember, it’s not their money. It’s yours.
Earnings do not support the current bullish thesis.
As we just wrote in “Close, But No Cigar:”
“What eventually sparks a reversion is always the one thing no one is anticipating. Throughout history, the unexpected, exogenous event is what sends investors fleeing for the exits. After the damage occurs, the media’s excuse is always: ‘Well, no one could have seen that coming.’
As noted above, overbought, extended, overly bullish markets are by themselves ‘bullish.’ These conditions represent the current ‘momentum,’ which keeps pushing assets higher and dragging investors into the market.
It’s very much like a crowded theater. Everything is fine until that point where someone yells ‘fire.’ At that point, everyone tries to rush towards a very narrow exit.”
The market is currently trading at absurd valuation levels. There is little to support the idea of a “V-shaped” recovery at this point.
Investor “psychology” will collide with “reality,” and the rush to exit will not be a slow and methodical process. Instead, much like we saw in March, it will be a stampede with little regard to price, valuation, or fundamental measures.
The exit will become very narrow.
Disclaimer: Real Investment Advice is powered by RIA Advisors, an investment advisory firm located in Houston, Texas with more than $800 million under management. As a team of certified and ...
more


Fundamentals are not driving the market. Money movement towards growth companies or those that are less affected by Covid is along with mass movement to large caps who are less affected by Covid and can eat up small businesses. Intelligent people are moving money out of bonds and other investments into stocks. I suspect the next big move will be out of housing and commercial property into such companies as property values languish and rents decrease.
Interesting concept, but you have a point. People are still terrified of COVID-19 and it is likely that we will see a permanent shift towards work-at-home. Many companies have begun to move this way just because workers seem to prefer it. Those companies that can help with this will likely see increased business. I'm still not sure that justifies some of the insane valuations that we are seeing though.
I agree with you about not being in commercial property. Residential property REITs might hold up okay because people still need a place to live but they are still dangerous in the short-term because about a third of renters nationwide are behind on their rents. Where I live though, rents actually have gone up slightly (although vacancies also appear to be ticking up). When it comes to REITs, I'd rather be in something like a farmland or data center REIT right now.
The market is not being driven by fundamentals. It is being driven by passion.
If you equal-weight the S&P 500, it's only a percentage point or two above its March lows. Literally, all of the action is being driven by the five mega-cap tech stocks that now account for 23% of the total market cap of the entire index.
The Federal Reserve has added more than $3 trillion to its balance sheet since March and that money needs a home because everybody is so terrified about inflation that they are afraid to sit on cash. They are therefore buying the momentum stocks (The FAAMG names + TSLA).
This is exactly what a bubble looks like. You will never see a greater destruction of wealth than when this bubble bursts. The question is when exactly it will happen.
Announcing great future earnings is the major responsibility of the CEOs. That is what we must all understand, that pumping sunshine is why they are so well compensated. The twisting of truth is certainly a talent of some.
The accounting of growth is also some strange math. After that 2008 crunch the reported recovery always seemed to pick the very lowest point to use as the reference, instead of the value the week prior to the crunch. The actual prices were seldom much better than the two weeks prior, and often a fair bit lower. The 25% increase above a value that had just fallen 40% is an impressive recovery until the actual numbers are seen.
And the method of under-predicting profits a bit is certainly a trusted method of setting things up to claim great successes.
Wise words.
Thank You. The reporting reference point has always seemed a bit funny. But it does give a more impressive number.