

Image Source: Pexels
With NFP at +22K < +75K Bloomberg consensus (hinted at by Trump signaling “pay no heed to the numbers behind the curtain”), we have the following picture of key indicators of the NBER’s BCDC (including the 48K downward revision in previous two months):
(Click on image to enlarge)
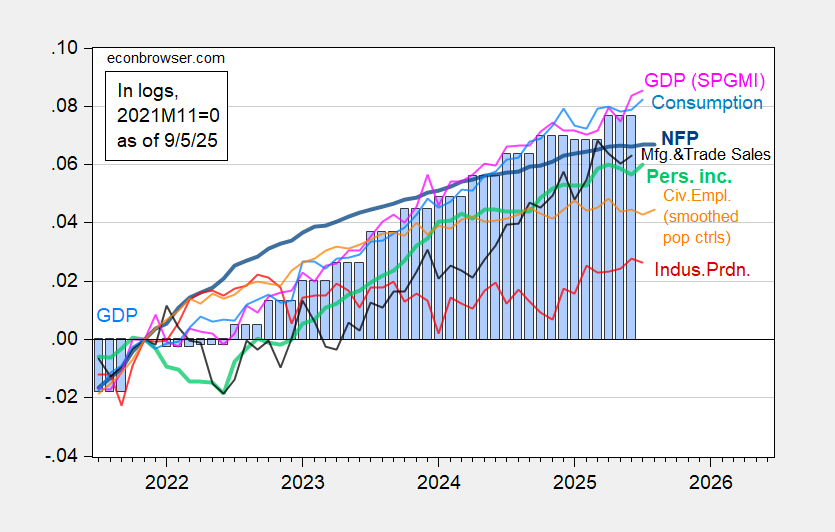
Figure 1: Nonfarm Payroll from CES (bold blue), civilian employment with smoothed population controls (orange), industrial production (red), Bloomberg consensus industrial production of 8/14, (red square), personal income excluding current transfers in Ch.2017$ (bold light green), manufacturing and trade sales in Ch.2017$ (black), consumption in Ch.2017$ (light blue), and monthly GDP in Ch.2017$ (pink), GDP (blue bars), all log normalized to 2021M11=0. Source: BLS via FRED, Federal Reserve, BEA 2025Q2 second release, S&P Global Market Insights (nee Macroeconomic Advisers, IHS Markit) (9/2/2025 release), and author’s calculations.
Notice that the Mean Absolute Revision going from first to third release in 2022-24 period is about 40K, so the approximate 95% confidence interval is -62K to +102K.
While smoothed civilian employment rose slightly (orange line), given the variability in this series, should be taken as essentially zero growth. Overall, civilian employment is below recent peak. All in all, these numbers are consistent with a cooling labor market, as discussed in yesterday’s post.
Monthly GDP released on Tuesday by S&P Global, rose at a decelerated rate — 2.4% m/m AR in July vs. 11% in June.
More By This Author:
Trouble In Estimating Seasonals As A Reason For The Low NFP Growth?
Mid-Session Review Technical Supplement Is Out
How’s Manufacturing Doing?


Comments
Log in or sign up to join the conversation.