

Image Source: Pexels
Since “Liberation Day”, so-so:
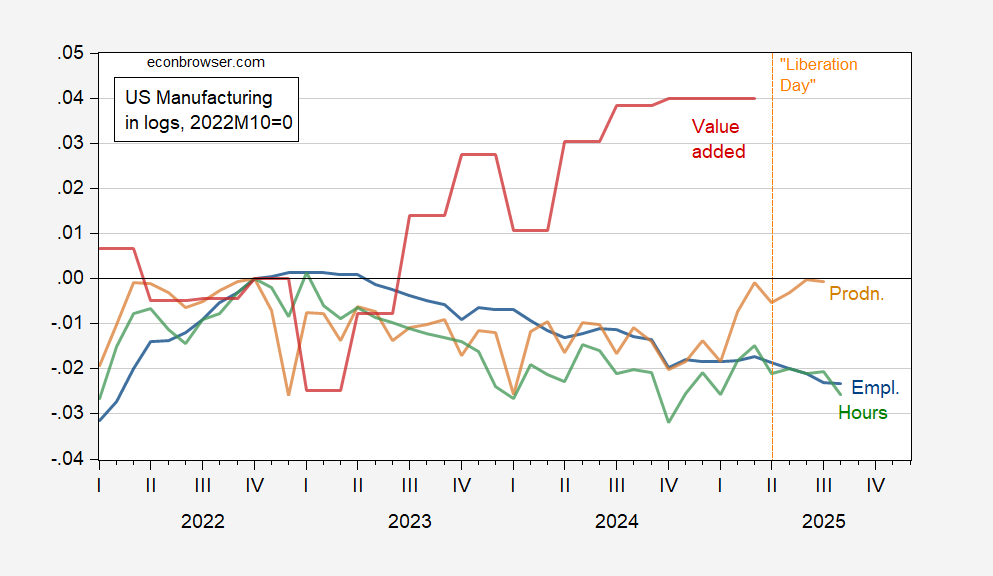
Figure 1: Manufacturing employment, production and nonsupervisory workers (blue), aggregate worker hours (green), manufacturing production (tan), real value added (red), all in logs, 2022M10=0. Aggregate hours calculated by multiplying employment by weekly average hours. Source: BLS, Federal Reserve, BEA, and author’s calculations.
Manufacturing production (a gross measure) is at best flat since just before “Liberation Day”, while labor market indicators are unambiguously down. When tariffs are more fully implemented, will employment rise? I doubt it, but even if production is on-shored, I suspect automation will result in little net employment increase (see Firooz, Leduc, and Liu, 2025).
More By This Author:
The Data Are Pretty Clear That We Are Not In A RecessionYield Curves Over The Last Year
The Employment Picture — Pre-August Release


Comments
Log in or sign up to join the conversation.