
Consider the following model (from ):
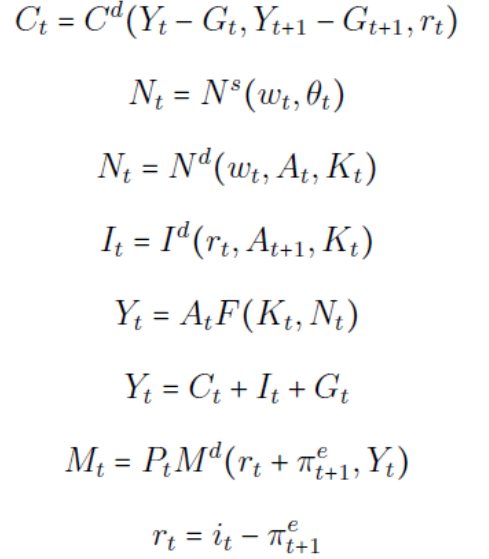
Where

Do the following graphs of GDP, productivity shocks (ΔA) and unemployment benefits (Δθ) make sense in the context of the neoclassical model? That is, do the series in the bottom two graphs seem to explain the behavior in the series (e.g., recessions, booms) in the top graph?

Figure 1: Top panel – GDP in bn.Ch.2012$ SAAR. Middle panel: annualized quarter-on-quarter growth in total factor productivity adjusted for capacity utilization. Bottom panel: annualized quarter-on-quarter growth in real unemployment benefits. NBER defined peak-to-trough recession dates shaded gray. Source: BEA via FRED, SF Fed, NBER, and author’s calculations.
More By This Author:
Recession Six Months Away?
The “Godot” Recession?
Russia: Waiting For Inflation?


Comments
Log in or sign up to join the conversation.