
M/M CPI inflation 0.4% vs. Bloomberg consensus 0.6%, while core was 0.3% vs. 0.5%. All measures (m/m, q/q, y/y, headline/core) below recent peaks.
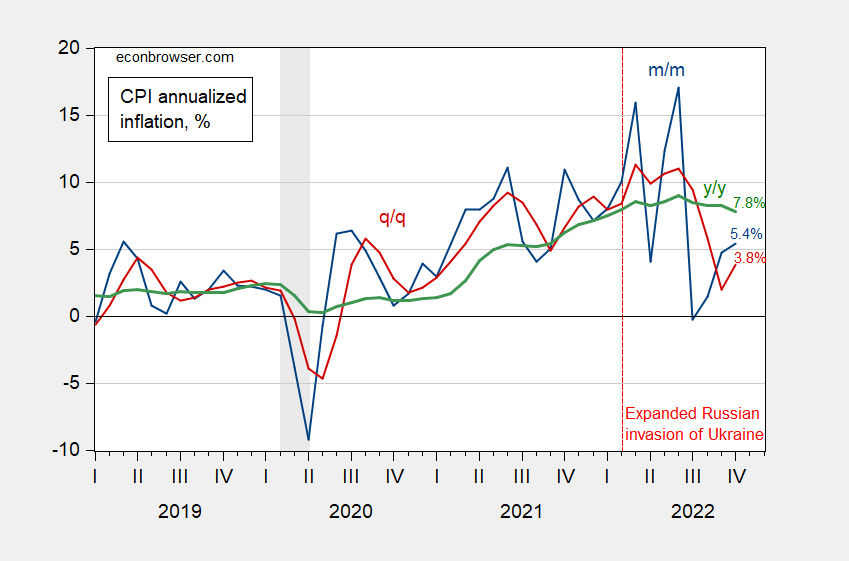
Figure 1: Headline CPI inflation, m/m (blue), q/q (red) and y/y (green), annualized, %. NBER defined peak-to-trough recession dates shaded gray. Source: BLS, NBER and author’s calculations.
Here’s the evolution of the core CPI, using the same scale on the left axis as for headline.
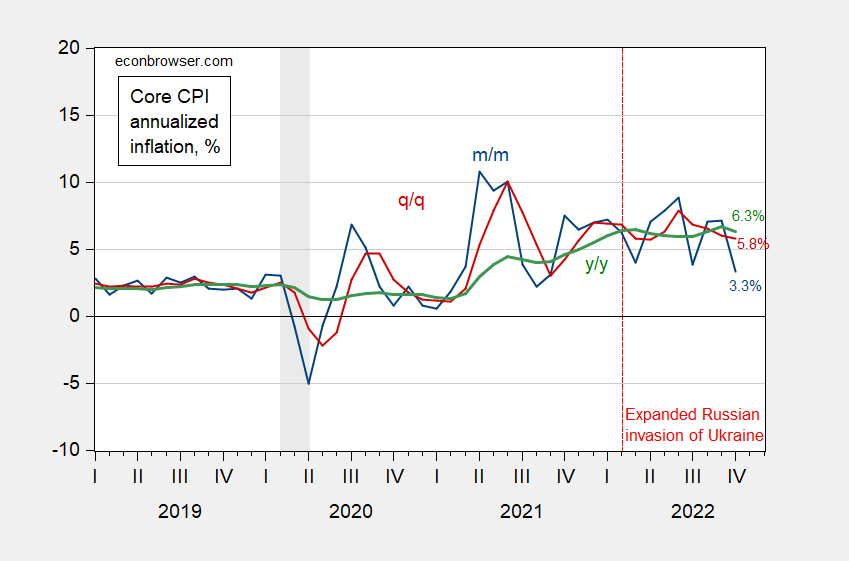
Figure 2: Core CPI inflation, m/m (blue), q/q (red) and y/y (green), annualized, %. NBER defined peak-to-trough recession dates shaded gray. Source: BLS, NBER and author’s calculations.
Finally, note the official CPI is a Laspeyres base year weights (with the weights changing more often in recent years), so tends to overstate — for any given bundle of goods and services — the rate of inflation. The chained CPI mitigates that by having the bundle change each year. The PCE deflator is a chained index which, aside from the included goods and services, should also incorporate spending changes more rapidly than the Laspeyres type indexes.
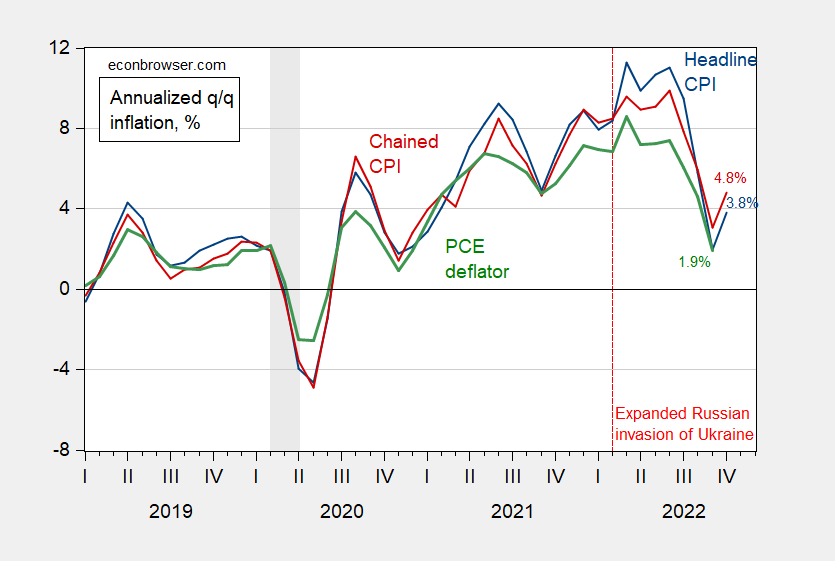
Figure 3: Headline CPI (blue), chained CPI (red) and personal consumption expenditure deflator (green), q/q annualized, %. Chained CPI adjusted using Census X-13, ARIMA X-11 seasonal adjustment. NBER defined peak-to-trough recession dates shaded gray. Source: BLS, BEA, NBER and author’s calculations.
Addendum:
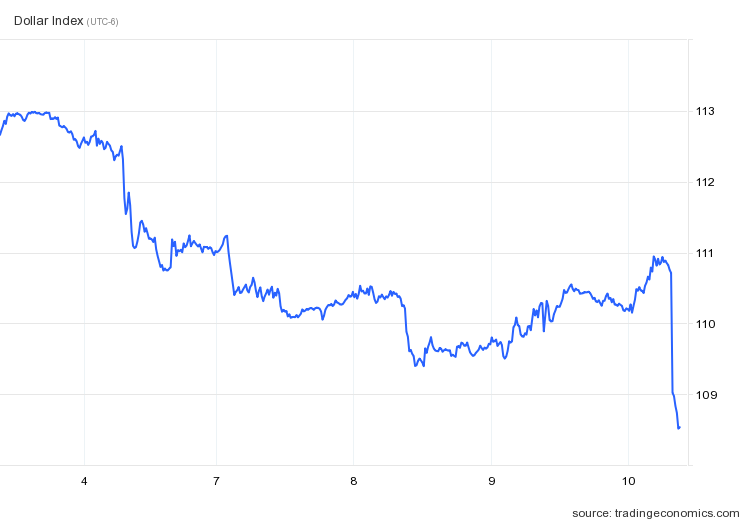
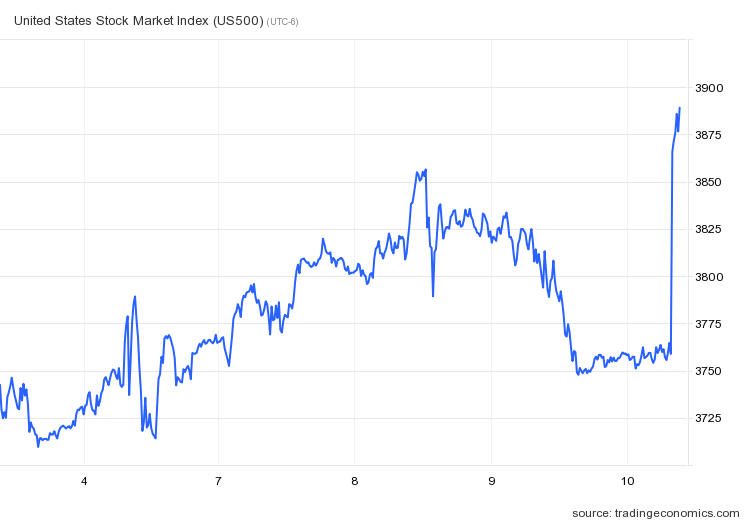
Market response was large and immediate. Ten-year bond yield, dollar index both down. Stock market up.

More By This Author:
Real Median Weekly Earnings: CPI Vs. Chained CPI
Reminder: Using The “Two-Consecutive-Quarter Rule” There Is No 2001 Recession
Messages From The Labor Market Release


Comments
Log in or sign up to join the conversation.