
The recession is (probably) not here yet (nor was it likely here earlier this year), employment likely continued to grow, and real wages are on average higher than they were before the pandemic. First, key business cycle indicators followed by the NBER BCDC continue uptrend in October, with exception of the civilian employment series based on the household series.
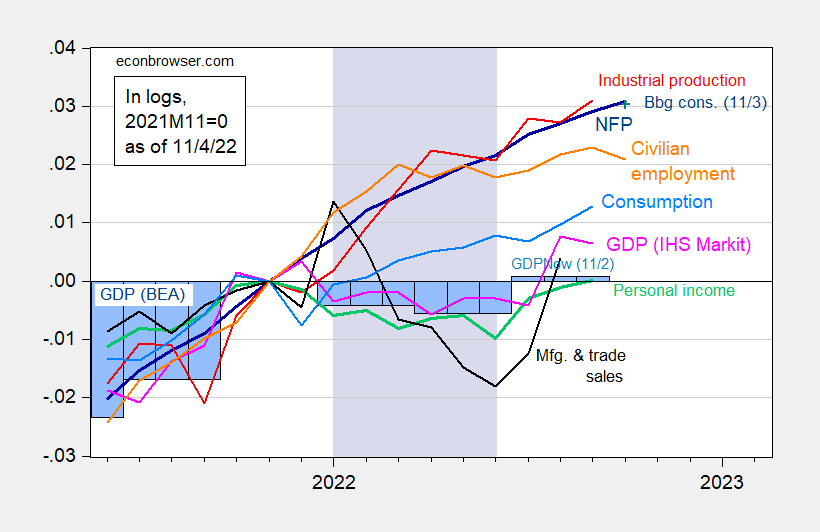
Figure 1: Nonfarm payroll employment, NFP (dark blue), Bloomberg consensus as of 11/3 (blue +), civilian employment (orange), industrial production (red), personal income excluding transfers in Ch.2012$ (green), manufacturing and trade sales in Ch.2012$ (black), consumption in Ch.2012$ (light blue), and monthly GDP in Ch.2012$ (pink), GDP (blue bars), all log normalized to 2021M11=0. Q3 GDP is from GDPNow for 11/1. Lilac shading denotes a hypothetical recession in 2022H1. Source: BLS, Federal Reserve, BEA, via FRED, IHS Markit (nee Macroeconomic Advisers) (11/1/2022 release), GDPNow (11/1) and author’s calculations.
Note that the NBER BCDC places primary emphasis on employment and personal income (and not necessarily GDP).
What about employment? Recall, the nonfarm payroll series is usually considered much more informative regarding the business cycle than the civilian employment series, and is less variable. However, the establishment series is also subject to sometimes substantial annual revisions, as more tax information comes in (e.g., from the Quarterly Census of Employment and Wages, QCEW). I have calculated the series implied from the preliminary benchmark revision (which applies to March 2022 data), and plotted it, alongside the official series, and the household series adjusted to conform to the nonfarm payroll concept.
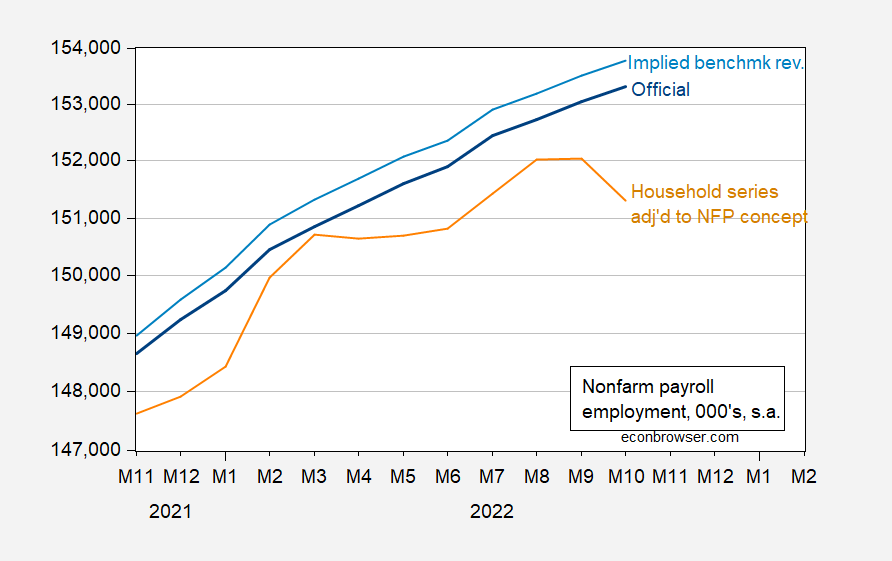
Figure 2: Nonfarm payroll employment (blue), implied benchmarked nonfarm payroll employment (light blue), and household survey employment adjusted to nonfarm payroll concept (tan), all in 000’s, s.a. Source: BLS via FRED, BLS, and author’s calculations.
Notice the continuously upward trajectory in the establishment series. While the household series flatten in the 2022H1, in the aggregate and adjusted to the NFP concept, the 2022M06 value is higher than the 2022M01 value. These observations suggest no recession in 2022H1, nor an ongoing recession (although — informally — a decline in the household series does seem to better presage a recessions with greater lead time than the establishment series).
There has been much commentary on the decrease in real wages over the past year. Figure 3 illustrates the decline in the CPI adjusted wage for nonsupervisory jobs in the private sector.
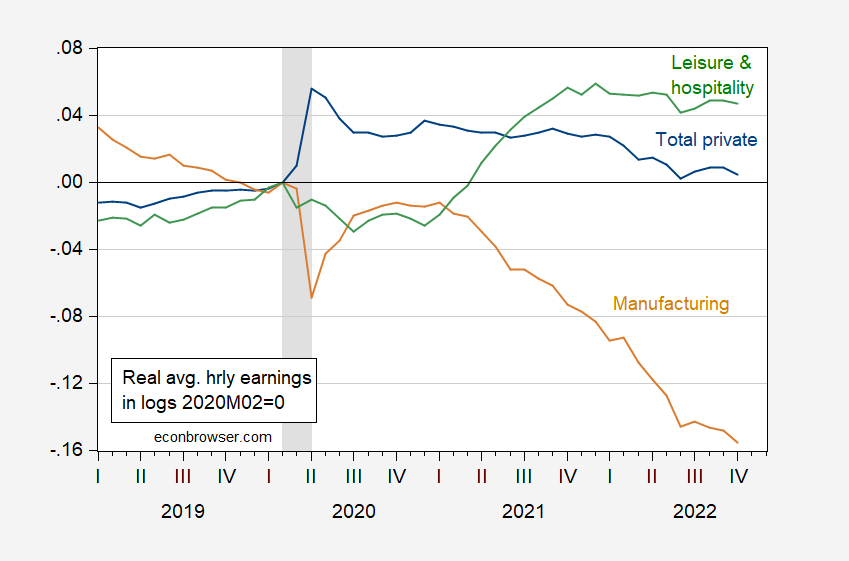
Figure 3: CPI deflated hourly wages, for total private (blue) manufacturing (tan), and leisure and hospitality (green), for nonsupervisory nonmanagerial jobs, in logs 2020M02=0. NBER defined peak-to-trough recession dates shaded gray. October CPI estimated using Cleveland Fed nowcast as of 11/4. Source: BLS via FRED, Cleveland Fed, NBER, and author’s calculations.
Notice that real average hourly earnings for leisure and hospitality workers have increased — and remained high — relative to pre-pandemic levels. Those interested in the equity aspects of the restructuring of the labor markets should take note. On the other hand, manufacturing has decreased nearly 16% relative to pre-pandemic levels. Presumably, some of this is driven by the strong dollar.
More By This Author:
Nowcasting The 2022H1 Or 2022H2 RecessionOn The Eve Of November FOMC
Natural Gas And LNG Exports Vs. Goods Exports


Comments
Log in or sign up to join the conversation.