
Chevron Vs. The S&P 500 Index
Earlier this week, Chevron (CVX) announced a massive year-over-year revenue increase. The company also reported record cash flow and a 6.3% dividend increase. Despite this, the stock price fell:
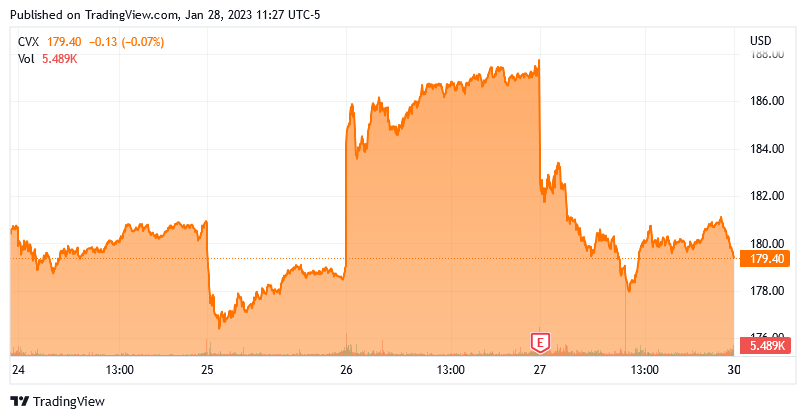
Source: Seeking Alpha
The reason for the stock price decline is that the company missed the earnings expectations that analysts had provided. However, cash flow is by far the most important metric for a business's performance. After all, this is the actual amount of money that the company's operations generate and this is the money that the company can use to reward its investors. I have stated this in various previous articles and I am hardly alone in this opinion. In fact, legendary investor Warren Buffett has stated that free cash flow is a far better metric to use to analyze a business than net income. This is also the basic assumption in the use of a discounted cash flow model to value a business. Chevron reported record operating and free cash flow in 2022 so the fact that it missed net income estimates is really not a big deal.
Chevron Is Undervalued
As I have pointed out many previous times, pretty much everything in the traditional energy industry is ridiculously undervalued right now. This is partly due to the rise of environmental, social, and governance principles at several of the major fund houses like BlackRock (BLK). Those investors and companies following these principles have essentially eschewed investing in fossil fuel companies and given the size of these investment houses, that means that there is a substantially lower amount of money available and attempting to purchase these stocks than there would be in a world in which decisions were made simply by classic valuation principles.
We can see this undervaluation by looking at Chevron's price-to-earnings growth ratio. This is a modified version of the traditional price-to-earnings ratio that takes the company's earnings per share growth into account. A stock that has a price-to-earnings growth ratio of less than 1.0 may be undervalued relative to its forward earnings per share growth and vice versa. However, there are almost no companies apart from traditional fossil fuel companies that are undervalued using this metric.
According to Zacks Investment Research, Chevron will grow its earnings per share at a 14.49% rate over the next three to five years. This gives the company a price-to-earnings growth ratio of 0.79 at the current price. Let us take a look at the numbers for a few other American traditional energy companies to drive home the point about the whole industry being undervalued:
| Company | 3-5 Year Growth Rate | PEG Ratio |
| Chevron | 14.49% | 0.79 |
| ExxonMobil (XOM) | 23.47% | 0.49 |
| ConocoPhillips (COP) | 18.26% | 0.58 |
| APA Corporation (APA) | 35.09% | 0.19 |
| Marathon Oil (MRO) | 23.03% | 0.33 |
Clearly, Chevron is the most expensive in the sector but it is still undervalued relative to its forward earnings per share growth.
We can also see the company's undervaluation by looking at its forward price-to-earnings ratio. This ratio tells us how much an investor would have to pay for each dollar of earnings that the company will generate over the next year. Here is the same table, showing these ratios:
| Company | Forward P/E |
| Chevron | 11.49 |
| ExxonMobil | 11.53 |
| ConocoPhillips | 10.59 |
| APA Corporation | 6.53 |
| Marathon Oil | 7.59 |
As of the time of writing, the forward price-to-earnings ratio of the S&P 500 Index is 20.17, which is on the high side of its historical average. Thus, we can easily see that all of these companies are incredibly cheap compared to the market average despite their high growth rates.
In fact, it is quite possible that analysts' earnings projections are too low in aggregate. As I have been discussing over the past several weeks on this blog, energy prices are almost certainly going to stay high and go up from here. Thus, Chevron and all of its peers are incredibly undervalued today.
High Valuation Of The S&P 500 Index
It gets even more dramatic when we consider that the S&P 500 Index is remarkably overvalued today. One very clear way that we can see this is by looking at a ratio called the total market cap-to-gross domestic product ratio. This ratio is not one that market analysts frequently discuss but Warren Buffett has stated that it is "probably the best indicator of where valuations stand at any given moment."
As of the market close on January 27, 2023, the Total Market Index stood at $40.6382 trillion, which is 158% of the last reported gross domestic product. That is not only substantially above the historical average ratio but it is pretty close to the level that the ratio stood at right before the market crashed back in 2000:
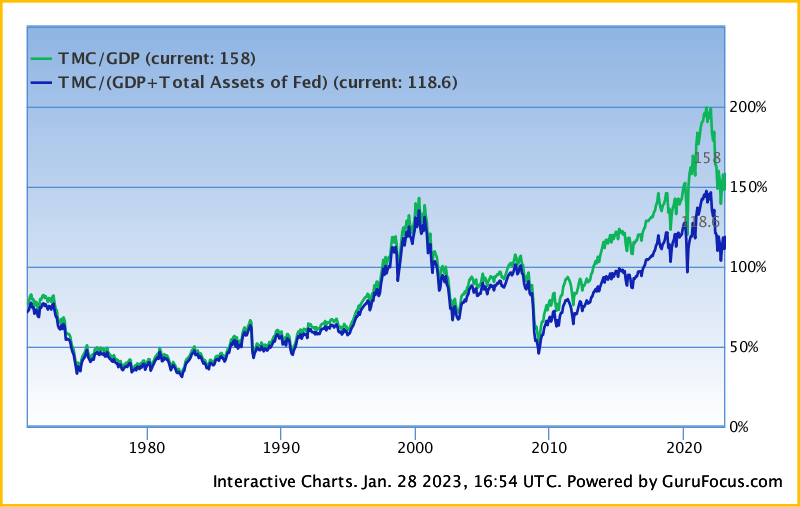
Source: GuruFocus
This ratio averages around 100% and it has always returned to its average level over the long term. Thus, it seems almost certain that anyone buying the index today will have very disappointing long-term returns. This is not the case for someone buying energy companies like Chevron today considering that these firms are undervalued, as we have already seen.
More By This Author:
Crack Spread Jumps To Three-Month High, Gas Prices To Follow
Understanding The Strong Fundamentals For Natural Gas Liquids
The Jobs Report Tells A False Narrative
We are currently offering a two-week free trial, so more


