
From Chicago Fed today:
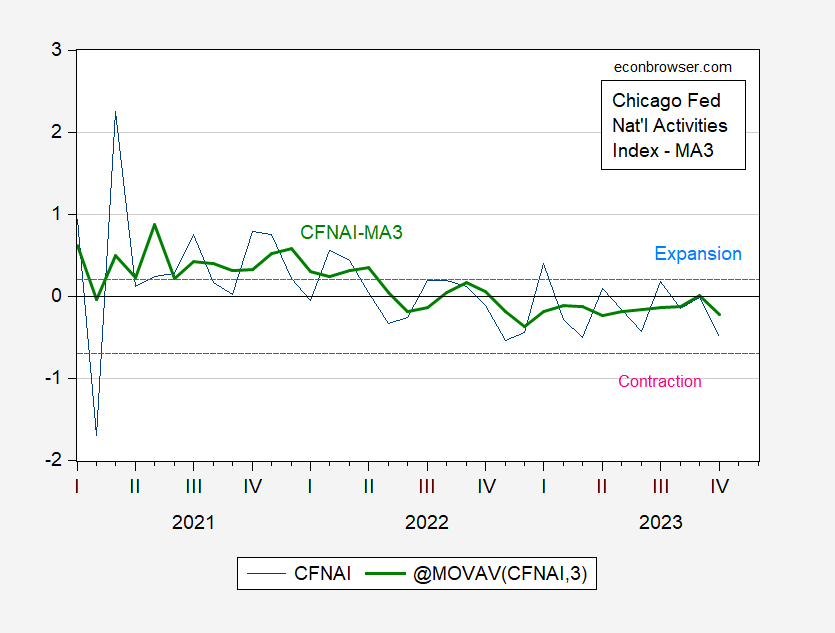
Figure 1: Chicago Fed National Activity Index (CFNAI) (blue), and 3 month moving average (bold green). Source: Chicago Fed via FRED, author’s calculations.
The three-month moving average of the CFNAI dropped below 0 (i.e., dropped below trend growth) in October of last year. The notes for the CFNAI indicate “Following a period of economic expansion, an increasing likelihood of a recession has historically been associated with a CFNAI-MA3 value below –0.70.” The CFNAI-MA3 has not breached this threshold; the current reading is -0.2.
Weekly indicators (for data through 11/11/2023) show y/y growth at or slightly above trend.
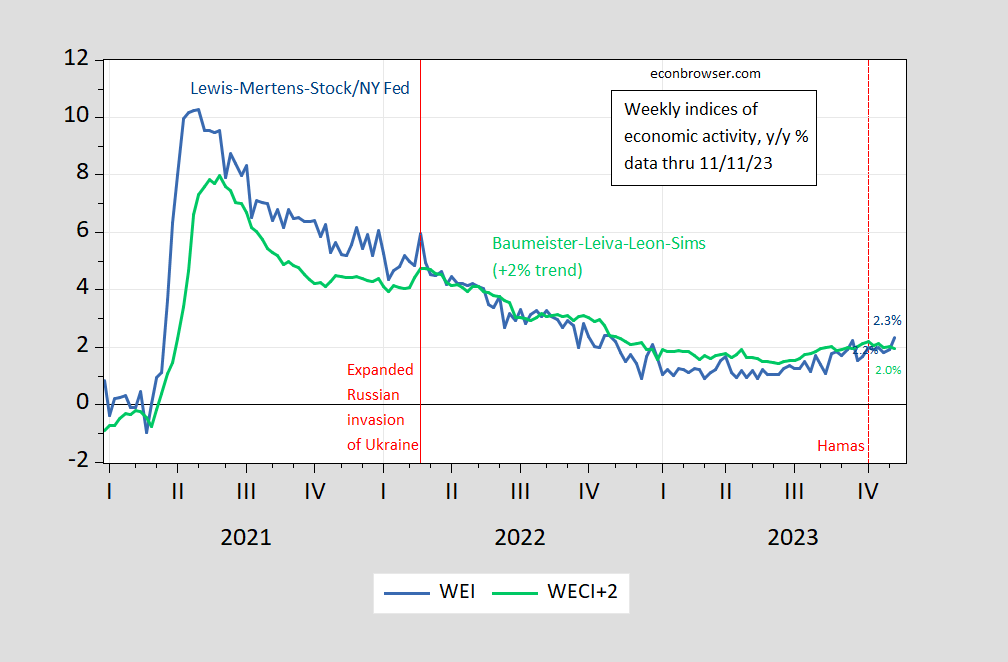
Figure 2: Lewis-Mertens-Stock Weekly Economic Index (blue), and Baumeister-Leiva-Leon-Sims Weekly Economic Conditions Index for US plus 2% trend (green), all y/y growth rate in %. Source: NY Fed via FRED, WECI, accessed 11/5, and author’s calculations.
The WECI+2% thru 11/11 is (2.0%), while the WEI reading is 2.35%. The latter is interpretable as a y/y quarter growth of 2.35% if the 2.35% reading were to persist for an entire quarter. The Baumeister et al. reading of -0.04% is interpreted as a 0.04% growth rate below the long term trend growth rate. Average growth of US GDP over the 2000-19 period is about 2%, so this implies a 1.96% growth rate for the year ending 11/11.
Recall the WEI relies on correlations in ten series available at the weekly frequency (e.g., unemployment claims, fuel sales, retail sales), while the WECI relies on a mixed frequency dynamic factor model.
Here are the conventional indicators followed by NBER BCDC, along with SPGMI’s monthly GDP.
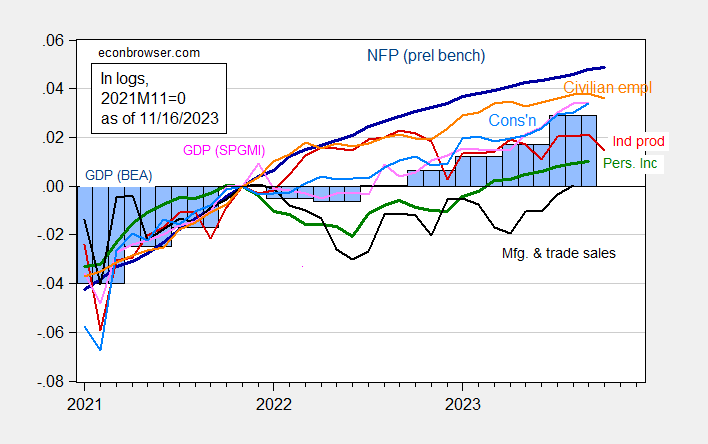
Figure 3: Nonfarm Payroll employment incorporating preliminary benchmark (dark blue), civilian employment (orange), industrial production (red), personal income excluding transfers in Ch.2017$ (green), manufacturing and trade sales in Ch.2017$ (black), consumption in Ch.2017$ (light blue), and monthly GDP in Ch.2017$ (pink), GDP (blue bars), all log normalized to 2021M11=0. Source: BLS via FRED, BLS preliminary benchmark, Federal Reserve, BEA 2023Q2 third release incorporating comprehensive revisions, S&P Global/IHS Markit (nee Macroeconomic Advisers, IHS Markit) (11/1/2023 release), and author’s calculations.
More By This Author:
Price Level For The Carnivore’s Breakfast/CommuteGDP Q4 Nowcasts Of November 17th
GDP And Interest Rate Forecasts And Recession From The SPF


Comments
Log in or sign up to join the conversation.