
The Q4 Survey of Professional Forecasters was released Monday. Accelerated growth is forecast, no yield curve dis-inversion, and triggering of the Sahm rule.
First, GDP:
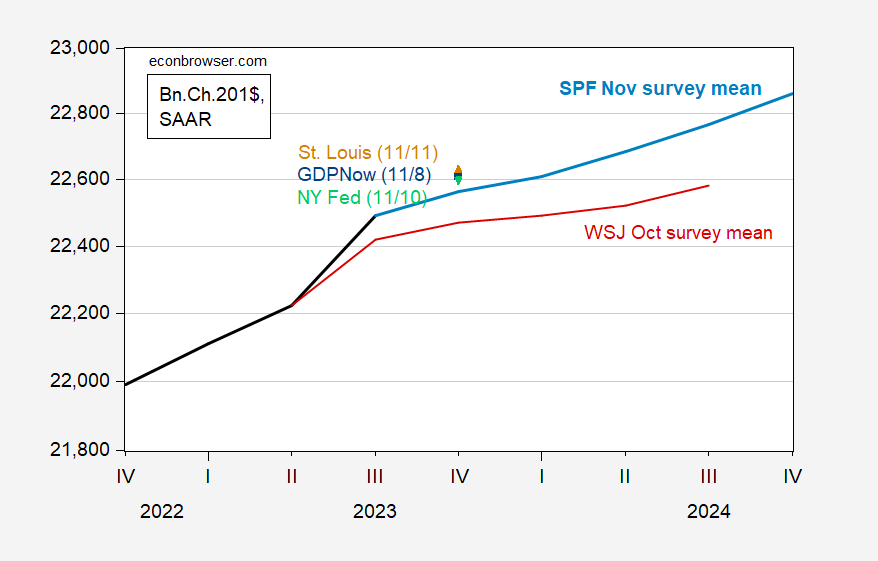
Figure 1: GDP as reported (bold black), GDPNow of 11/8 (blue square), NY Fed nowcast as of 11/10 (green inverted triangle), St. Louis Fed news nowcast (brown triangle), WSJ survey mean (bold dark red), SPF median (light blue), all in billions Ch.2017$, SAAR. Levels calculated on basis on advance GDP release figure. Note on log scale. Source: BEA 2023Q3 advance, Atlanta Fed, NY Fed, St.Louis Fed via FRED, WSJ, Philadelphia Fed SPF, and author’s calculations.
The path of unemployment can be interpreted in light of the Sahm Rule.
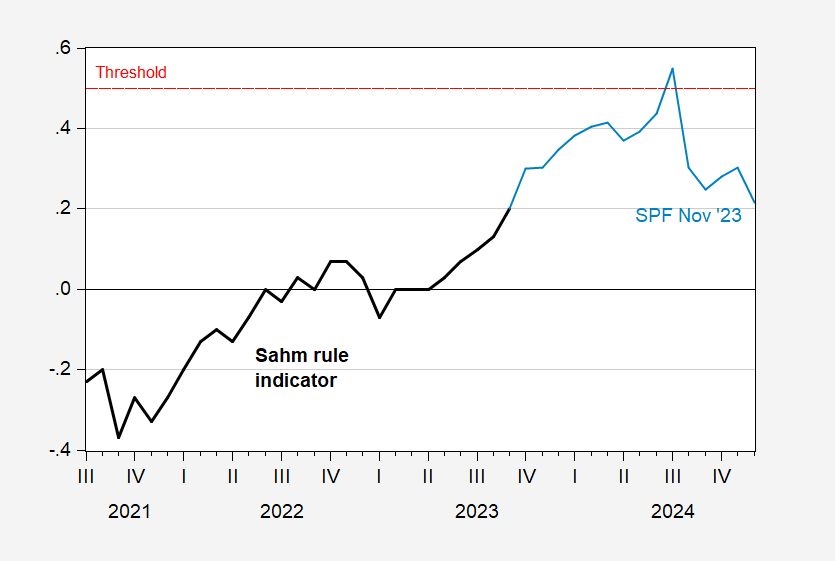
Figure 2: Sahm rule real time indicator, in % (bold black), and forecasted indicator from SPF (light blue). Quarterly forecasted figures quadratic interpolation to monthly. Dashed red line is 0.50% threshold. Source: FRED, Philadelphia Fed SPF, and author’s calculations.
This suggests Sahm rule trigger in July, although the interpolation procedure makes timing the exact month tricky.
The interest rate forecast is for rates peaking in 2023Q4.
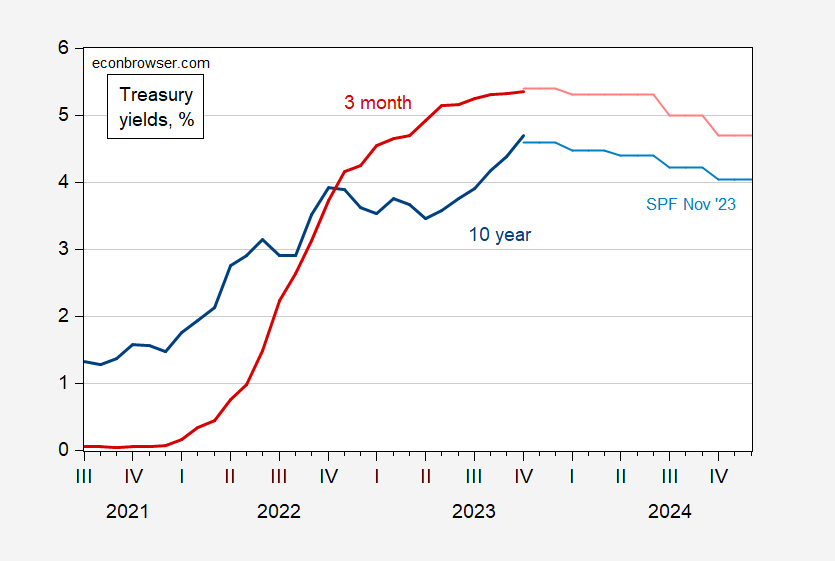
Figure 3: Three month Treasury yield (bold dark red), and forecasted three month yield (red), and ten year Treasury yield (bold dark blue), and forecasted ten year (light blue), all in %. Source: Treasury via FRED, and Philadelphia Fed SPF.
For 2023Q4, forecasted 10yr is 4.6%, vs. 3.9% in the previous survey (August). The peak rate is moved back to 2023Q4 from 2023Q3.
More By This Author:
CPI Inflation In OctoberTaiwan Straits Balance of Forces, 2023
Growth Nowcasts For Q4


Comments
Log in or sign up to join the conversation.