
From CBO’s Current View of the Economy From 2023 to 2025:
Compared with its February 2023 projections, CBO’s current projections exhibit weaker growth, lower unemployment, and higher interest rates in 2024 and 2025.2 The agency’s current projections of inflation are mixed relative to those made in February 2023.
Table 1 summarizes:
(Click on image to enlarge)

CBO’s path for GDP looks slightly better than the Survey of Professional Forecasters median, matches the 2024Q4 FT-IGM forecast. Some differences arise from the information sets — SPF was based on beginning November data, CBO’s on data up to December 5th. The December 14 Atlanta Fed GDPNow implied level of GDP is substantially above the CBO path (GDPNow is 2.6% q/q SAAR vs. CBO 0.8%).
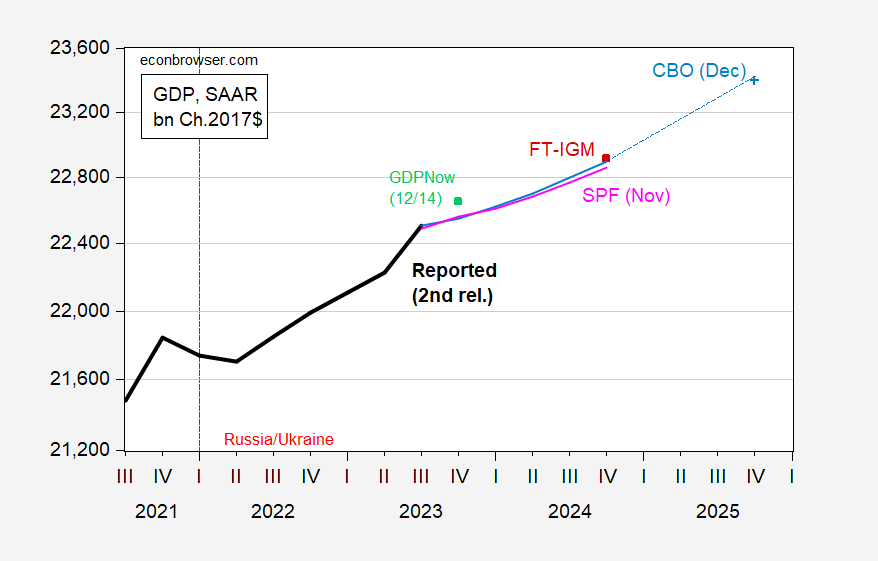
Figure 1: GDP (bold black), CBO December projection (sky blue), Survey of Professional Forecasters November median forecast (pink), FT-IGM December median (red square), GDPNow of 14 December (green square), all in bn.Ch.2017$ SAAR. Source: BEA 2023Q3 2nd release, CBO (December 2023), Philadelphia Fed, Atlanta Fed, and author’s calculations.
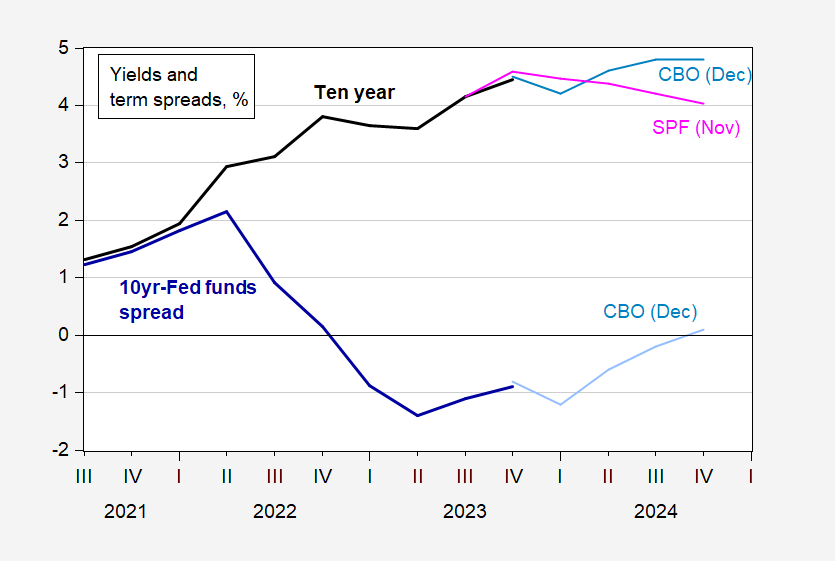
Figure 2: Ten year Treasury yield (bold black), CBO projection (sky blue), Survey of Professional Forecasters median (pink), in %; 10 yr – Fed funds spread (bold blue), CBO projection (light blue), in %. 2023Q4 observations are for data through Dec. 15. Source: Treasury, Federal Reserve Board via FRED, CBO (December 2023), and author’s calculations.
There’s an interesting divergence between SPF survey forecasts and CBO projections, where CBO projects a temporary decline and then increase. SPF (admittedly from November as opposed to December) sees a steady decline. Two points highlighted by CBO explain why the interest rate path is higher than in February:
- Higher interest rates in 2024 and 2025 reflect stronger economic activity in 2023, which resulted in the Federal Reserve raising the target range for the federal funds rate higher than what CBO projected in February 2023.
- The upward revision to inflation in the consumer price index for all urban consumers (CPI-U) in 2025 (by 0.3 percentage points) reflects faster-than-expected growth in the cost of housing services. (The CPI-U places more weight on the cost of housing services than the PCE price index does.) PCE inflation in 2024 that is lower than previously projected (by 0.3 percentage points) stems from better-than-expected improvements in supply conditions affecting prices that receive more weight in the PCE price index than in the CPI-U.
One thing to remember is that CBO is required to make projections based on current law. SPF and FT-IGM respondents are not, and can condition on anything.
The higher, longer interest rates is demonstrated — relative to February, but not so much to July.
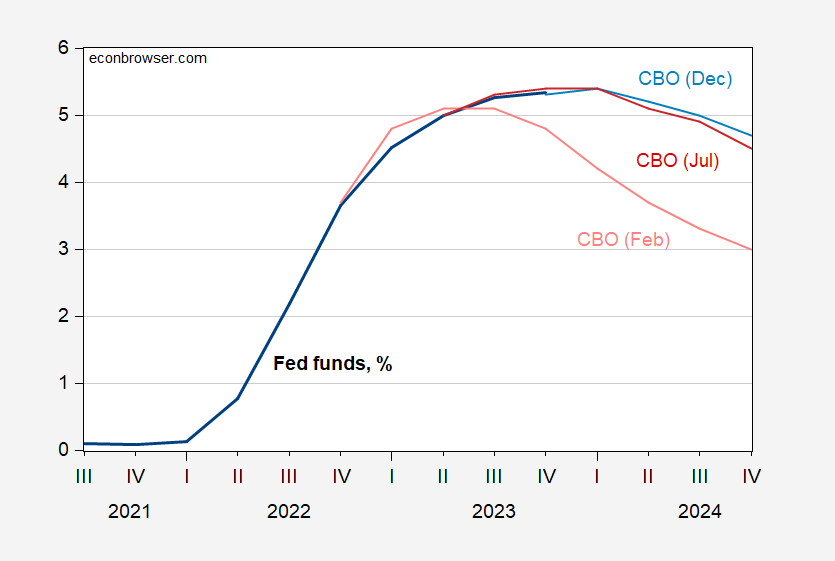
Figure 3: Fed funds (bold black), CBO projection (sky blue), CBO July projection (red),CBO Feb projection (salmon), in %. 2023Q4 observations are for data through Dec. 15. Source: Treasury, Federal Reserve Board via FRED, CBO (December 2023), and author’s calculations.
Note that the projected Fed funds rate is for a projected December 2024 12-month PCE inflation rate of 2.1% (2.4% core).
More By This Author:
Russia’s Economy Is Falling Behind
Sentiment By Survey And By Text Analysis
Business Cycle Indicators, Mid-December


Comments
Log in or sign up to join the conversation.