
The Michigan survey of consumer sentiment has diverged its correlation with unemployment and inflation, as has (to a lesser degree) the Conference Board survey of confidence. Interestingly, they’ve both diverged from sentiment as measured by text analysis.
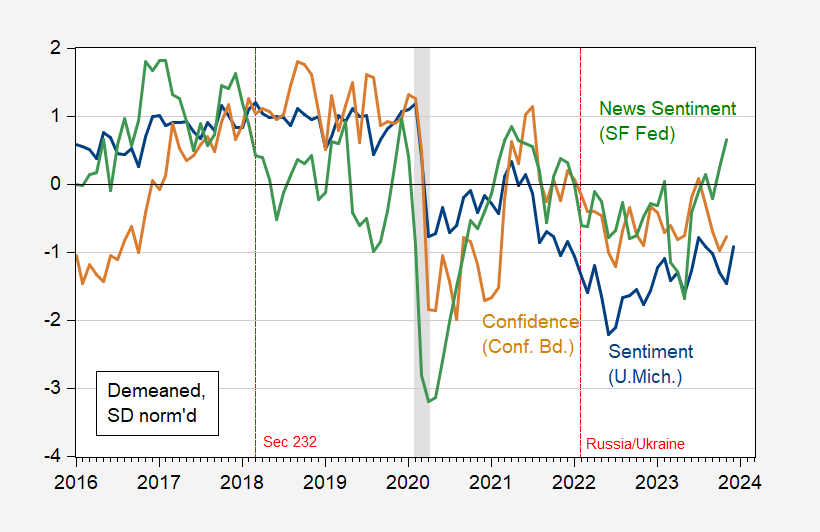
Figure 1: University of Michigan Consumer Sentiment (blue), Conference Board Consumer Confidence (tan), and Shapiro, Sudhof and Wilson (2020) Daily News Sentiment Index (green), all demeaned and normalized by standard deviation (for the displayed sample period). Michigan December observation is preliminary. NBER defined peak-to-trough recession dates shaded gray. Source: U.Mich via FRED, Conference Board via Investing.com, SF Fed, NBER, and author’s calculations.
To the extent that the survey-based and news text-based series diverge, this gives some support to the Vibes view of the dour mood of the public (subject to the condition that the Daily News Index accurately summarizes the news).
More By This Author:
Business Cycle Indicators, Mid-DecemberNews And The Market-Implied Fed Funds Path
November CPI: Headline, Core, Supercore, Trimmed, Median, And Instantaneous


Comments
Log in or sign up to join the conversation.