
Industrial production under consensus (-0.2% m/m vs +0.3% Bloomberg consensus). Here’s the picture of some key indicators followed by the NBER Business Cycle Dating Committee, plus monthly GDP and GDPNow.
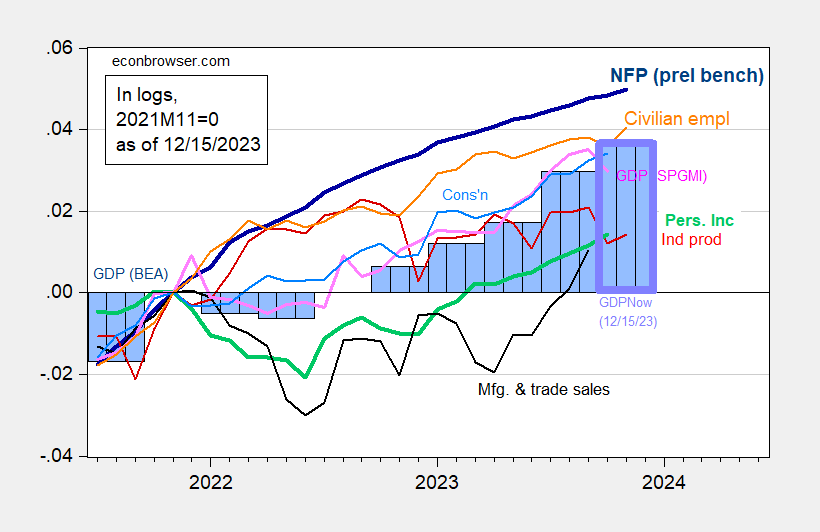
Figure 1: Nonfarm Payroll employment incorporating preliminary benchmark (bold dark blue), implied level using Bloomberg consensus as of 12/4 (blue +), civilian employment (orange), industrial production (red), personal income excluding transfers in Ch.2017$ (bold green), manufacturing and trade sales in Ch.2017$ (black), consumption in Ch.2017$ (light blue), and monthly GDP in Ch.2017$ (pink), GDP, 2nd release (blue bars), and GDPNow for 2023Q4 as of 12/15 (lilac box), all log normalized to 2021M11=0. Source: BLS via FRED, BLS preliminary benchmark, Federal Reserve, BEA 2023Q3 2nd release incorporating comprehensive revisions, S&P Global/IHS Markit (nee Macroeconomic Advisers, IHS Markit) (12/1/2023 release), Atlanta Fed, and author’s calculations.
Note that as of today, GDPNow is at 2.6% for Q4 (q/q SAAR), up from 1.2% on 12/7. NY Fed nowcast is at 2.21% for Q4 (and 1.98% for 2024Q1).
More By This Author:
News And The Market-Implied Fed Funds Path
November CPI: Headline, Core, Supercore, Trimmed, Median, And Instantaneous
Non-Inflation Release Items: Oil, Urals, Gas Prices, Inflation Expectations, China Deflation


Comments
Log in or sign up to join the conversation.