
Instantaneous below y/y:
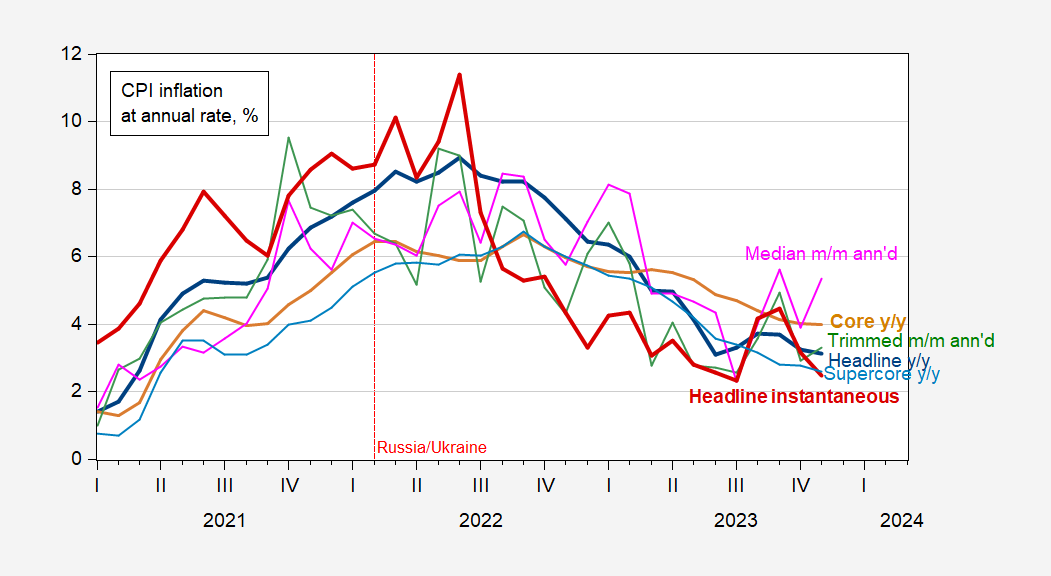
Figure 1: Headline CPI inflation, y/y (bold blue), core CPI inflation y/y (tan), trimmed-mean CPI inflation m/m ann’d (tan), median CPI inflation m/m ann’d (pink), headline CPI instantaneous, T=12, a=4 per Eeckhout (bold red), all in %. Source: BLS, Cleveland Fed via FRED, BLS, and author’s calculations.
Using a series of measures that are supposed to track the trend in inflation (core, supercore, median, mean, and instantaneous), it certainly appears as if inflation is declining, even if not as fast as one would like.
Instantaneous inflation (T=12, a=4) is now at 2.4%. The implied CPI target conforming to 2% PCE inflation is about 2.45% (0.45 is the difference between CPI and PCE inflation over the 1986-2019 period), so instantaneous inflation is at about the implied target.
BLS supercore y/y inflation at 2.6%. For everything you wanted to know about core services ex shelter inflation, see Pawel Skrzypczynski’s website. y/y right now at 4.1%, up from 3.9% in October.
Here’s the Headline and Core instantaneous inflation compared.

Figure 2: Headline CPI instantaneous inflation, y/y (bold blue), core CPI instantaneous inflation (tan), both T=12, a=4 per Eeckhout (bold red), all in %. Source: BLS, and author’s calculations.
Note that while the m/m core popped up, the instantaneous core was flat.
More By This Author:
Non-Inflation Release Items: Oil, Urals, Gas Prices, Inflation Expectations, China Deflation
The Inflation Surge Forecasted Or Not
Michigan Sentiment Surprises


Comments
Log in or sign up to join the conversation.