
November industrial and manufacturing production both surprised on the downside — -0.2% and -0.1% vs. +0.1% and -0.1% m/m (Bloomberg). This is the resulting picture for some key variables followed by the NBER Business Cycle Dating Committee.
(Click on image to enlarge)
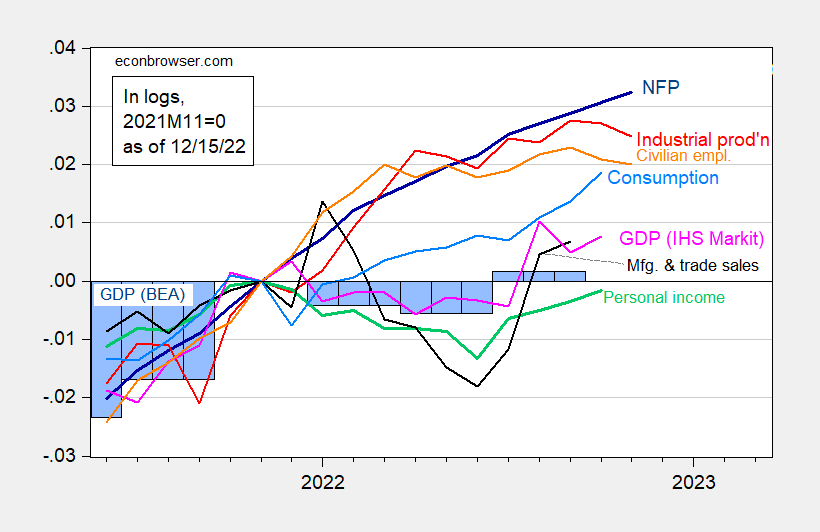
Figure 1: Nonfarm payroll employment, NFP (dark blue), civilian employment (orange), industrial production (red), personal income excluding transfers in Ch.2012$ (green), manufacturing and trade sales in Ch.2012$ (black), consumption in Ch.2012$ (light blue), and monthly GDP in Ch.2012$ (pink), GDP (blue bars), all log normalized to 2021M11=0. Q3 Source: BLS, Federal Reserve, BEA, via FRED, IHS Markit (nee Macroeconomic Advisers) (12/1/2022 release), and author’s calculations.
Retail sales (not in the set above) also declined -0.6% m/m, below -0.1% m/m in Bloomberg consensus.
Q4 GDPNow revised down from 3.4% q/q SAAR (12/9) to 3.2%, IHS-Markit/S&P Global at 3.3% down from 3.6% (12/9), while GS unchanged at 1.7%.
More By This Author:
Why The Increase In Multiple Job Holders Cannot Account For Most Of CES-CPS Discrepancy
The Household-Establishment Surveys Job Creation Conundrum
Month-on-Month Headline, Core inflation Down


Comments
Log in or sign up to join the conversation.