Business Cycle Indicators, As Of September 1
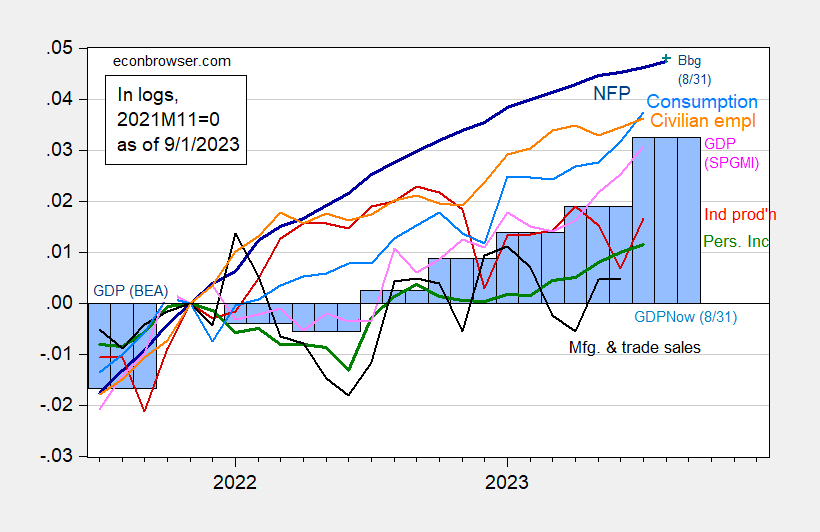
With the employment release, and the monthly GDP from SPGMI, we have the following picture of key macro indicators.

Figure 1: Nonfarm payroll employment, NFP (dark blue), Bloomberg consensus as of 8/31 assuming no revisions to previous months (blue +), civilian employment (orange), industrial production (red), personal income excluding transfers in Ch.2012$ (green), manufacturing and trade sales in Ch.2012$ (black), consumption in Ch.2012$ (light blue), and monthly GDP in Ch.2012$ (pink), GDP (blue bars), 2023Q2 is GDPNow of 8/31, all log normalized to 2021M11=0. Source: BLS, Federal Reserve, BEA 2023Q2 second release via FRED, Atlanta Fed, S&P Global/IHS Markit (nee Macroeconomic Advisers, IHS Markit) (9/1/2023 release), and author’s calculations.
With the preliminary benchmark in, knowing how BLS will “wedge in” the March 2023 downward revision of 306K, the best guess of the current NFP series is slightly downshifted, but doesn’t really change the picture of continuing growth.

Figure 2: Nonfarm payroll employment, NFP (dark blue), Bloomberg consensus as of 8/31 assuming no revisions to previous months (blue +), implied preliminary benchmark NFP (bold teal), civilian employment (orange), industrial production (red), personal income excluding transfers in Ch.2012$ (green), manufacturing and trade sales in Ch.2012$ (black), consumption in Ch.2012$ (light blue), and monthly GDP in Ch.2012$ (pink), GDP (blue bars), all log normalized to 2021M11=0. Source: BLS via FRED, BLS, Federal Reserve, BEA 2023Q2 second release via FRED, S&P Global/IHS Markit (nee Macroeconomic Advisers, IHS Markit) (9/1/2023 release), and author’s calculations.
More By This Author:
The Employment Release, News, And Futures-Implied Fed Funds
Velocity, 1967-2023Q2
Business Cycle Indicators For July


