Velocity, 1967-2023Q2
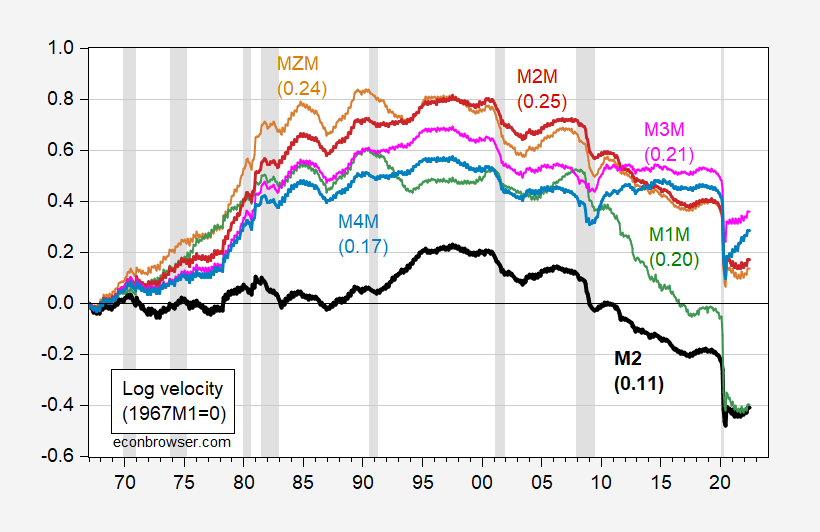
The variability of velocity calculated using divisia money indices is not necessarily lower than that using a conventional monetary aggregate, i.e., M2.

Figure 1: Log GDP divided by M2 (bold black), by MZM divisia (tan), by M1M divisia (green), by M2M divisia (red), by M3M divisia (pink), by M4M divisia (light blue), all 1967Q1=0. Numbers in (parentheses) are standard deviations for 1967-2019. NBER defined peak-to-trough recession dates shaded gray. Source: BEA (2023Q2 second release), Federal Reserve Board via FRED, Center for Financial Stabiity, NBER, and author’s calculations.
All the log velocity variables fail to reject the ADF unit root null (intercept, trend), and reject the KPSS trend stationary null. The standard deviation of M2 velocity is the smallest of all. In first differences, the standard M2 velocity and the divisia M2 velocity are about the same.
More By This Author:
Business Cycle Indicators For JulyPrivate Nonfarm Payroll Employment – Three Measures
GDO, Revised GDP For Q2


