Business Cycle Indicators For July
With personal income, consumption, and manufacturing and trade industry sales released, no downturn yet. If consensus holds, the momentum continues into August. Here are some key indicators followed by the NBER BCDC, along with monthly GDP and GDPNow.

Figure 1: Nonfarm payroll employment, NFP (dark blue), civilian employment (orange), industrial production (red), personal income excluding transfers in Ch.2012$ (green), manufacturing and trade sales in Ch.2012$ (black), consumption in Ch.2012$ (light blue), and monthly GDP in Ch.2012$ (pink), GDP (blue bars), 2023Q2 is GDPNow of 8/31, all log normalized to 2021M11=0. Source: BLS, Federal Reserve, BEA 2023Q2 second release via FRED, Atlanta Fed, S&P Global/IHS Markit (nee Macroeconomic Advisers, IHS Markit) (8/1/2023 release), and author’s calculations.
Concerns that the CES series (nonfarm payroll employment) followed by NBER BCDC is seriously overstating employment were allayed by the preliminary benchmark revision.
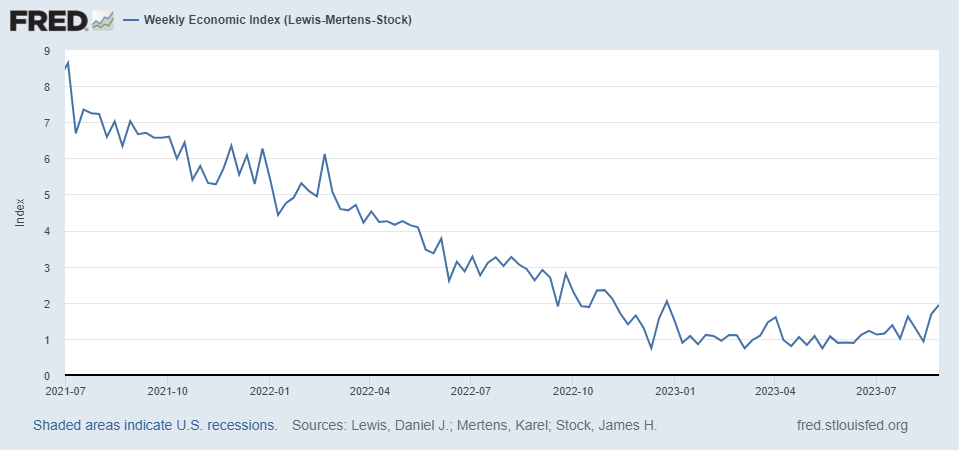
High frequency indicators, including the Lewis-Mertens-Stock (NY Fed) Weekly Economic Indicators show y/y growth of 1.94% for week ending 8/26.

More tomorrow with the employment release, and monthly GDP.
More By This Author:
Private Nonfarm Payroll Employment – Three MeasuresGDO, Revised GDP For Q2
The 2022H1 Recession Call In Hindsight, The 2023H2 Call In Context


