
With the Fed’s industrial production release (-0.6% m/m vs. -0.3% consensus) and retail sales (+1.0% m/m vs. +0.4% consensus), we have the following pictures, the first of the indicators followed by the NBER Business Cycle Dating Committee, plus monthly GDP.
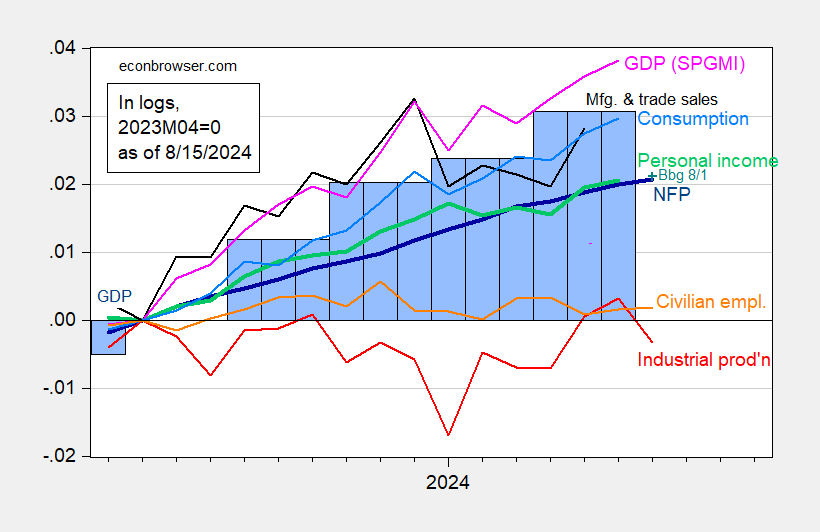
Figure 1: Nonfarm Payroll (NFP) employment from CES (bold blue), civilian employment (orange), industrial production (red), personal income excluding current transfers in Ch.2017$ (bold green), manufacturing and trade sales in Ch.2017$ (black), consumption in Ch.2017$ (light blue), and monthly GDP in Ch.2017$ (pink), GDP (blue bars), all log normalized to 2023M04=0. Source: BLS via FRED, Federal Reserve, BEA 2024Q2 advance release, S&P Global Market Insights (nee Macroeconomic Advisers, IHS Markit) (8/1/2024 release), and author’s calculations.
Industrial production sagged more than anticipated. The same is true for manufacturing production. In Figure 2, I show a series of alternative indicators, including manufacturing production, retail sales, and alternative civilian employment, as well as GDO.
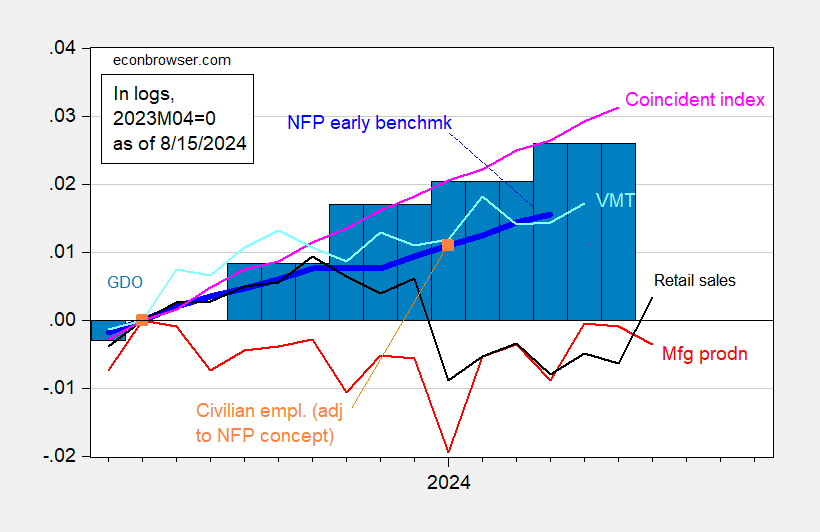
Figure 2: Nonfarm Payroll (NFP) employment Philadelphia Fed early benchmark (bold dark blue), civilian employment adjusted using population estimates of Edelberg and Watson (see text) (orange square), industrial production (red), personal income excluding current transfers in Ch.2017$ (bold green), manufacturing and trade sales in Ch.2017$ (black), consumption in Ch.2017$ (light blue), and Coincident Index (light pink), GDO (blue bars), all log normalized to 2023M04=0. GDI used in calculating GDO for 2024Q2 estimated by predicting 2024Q2 net operating surplus using GDP, lagged surplus, lagged differenced surplus, 2021Q1-2024Q1.Source: BLS via FRED, Federal Reserve, BEA 2024Q2 advance release, Philadelphia Fed, Edelberg and Watson (2024) population data provided in personal communication, and author’s calculations.
I applied labor force participation rates for native and foreign born populations to alternative estimates of population from Edelberg and Watson (2024). As they write in their report:
In our previous work, we provided evidence that CPS data underestimated the recent increase in the civilian non-institutionalized population of people in the United States ages 16 and up (hereafter referred to as the population). That piece presented estimates of aggregate population numbers and employment growth that were larger than published CPS data.
I then apply the reported unemployment rates for native and foreign born populations to the alternative labor force calculations to generate employment levels for each category. Summing the two provides an alternative employment level, which I then rescale to match 2021M01 levels (which predates the pandemic). In order to estimate a 2023M04 level (used to normalize), I do a geometric interpolation of 2023M01 and 2024M01 alternative levels.
GDPNow for Q3 as of today is 2.4%. The Lewis-Mertens-Stock NY Fed WEI reads 2.29% for data released through 8/10/2024.
More By This Author:
One Year Ahead CPI Inflation Expectations down in July for Consumers, Firms, Economists
Oxford Economics: Recession At 3 & 6 Months Horizons
Already In Recession?


Comments
Log in or sign up to join the conversation.