
Pascal Michaillat (UCSC) and Emmanuel Saez (UC Berkeley) say there is a 40% probability that US economy is already in recession.

From the abstract to the paper:
To answer this question, we develop a new Sahm-type recession indicator that combines vacancy and unemployment data. The indicator is the minimum of the Sahm indicator— the difference between the 3-month trailing average of the unemployment rate and its minimum over the past 12 months—and a similar indicator constructed with the vacancy rate—the difference between the 3-month trailing average of the vacancy rate and its maximum over the past 12 months. We then propose a two-sided recession rule: When our indicator reaches 0.3pp, a recession may have started; when the indicator reaches 0.8pp, a recession has started for sure. This new rule is triggered earlier than the Sahm rule: on average it detects recessions 1.4 months after they have started, while the Sahm rule detects them 2.6 months after their start. The new rule also has a better historical track record: it perfectly identifies all recessions since 1930, while the Sahm rule breaks down before 1960. With July 2024 data, our indicator is at 0.5pp, so the probability that the US economy is now in recession is 40%. In fact, the recession may have started as early as March 2024.
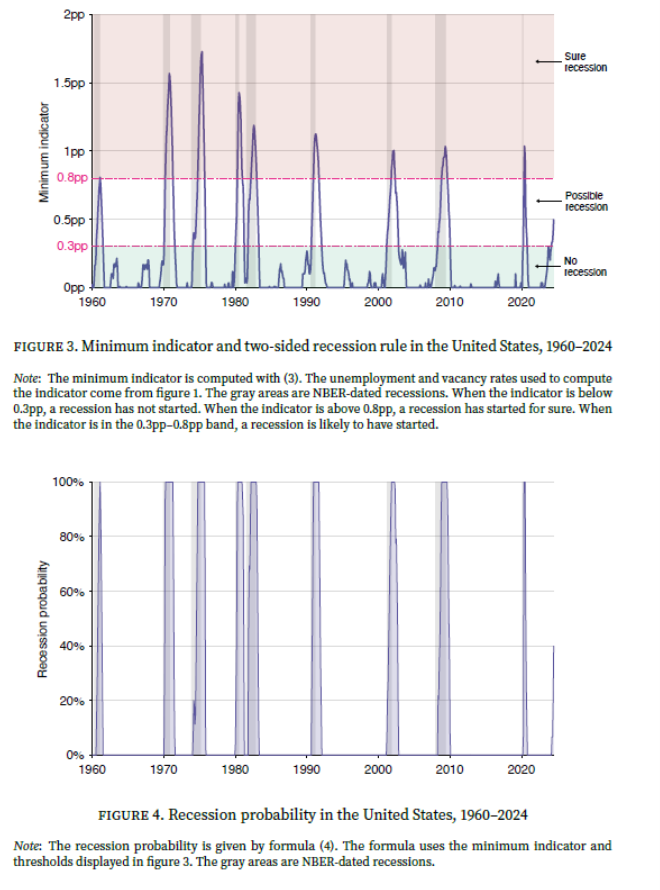
Source: Michaillat and Saez (2024).
As far as I can tell, the authors use final revised data, not realtime. It would be good to see if the results were robust to the use of realtime data, given the big effect of population controls especially in recent years.
Normalizing NBER indicators to 2024M03 as a peak, we have Figure 1:
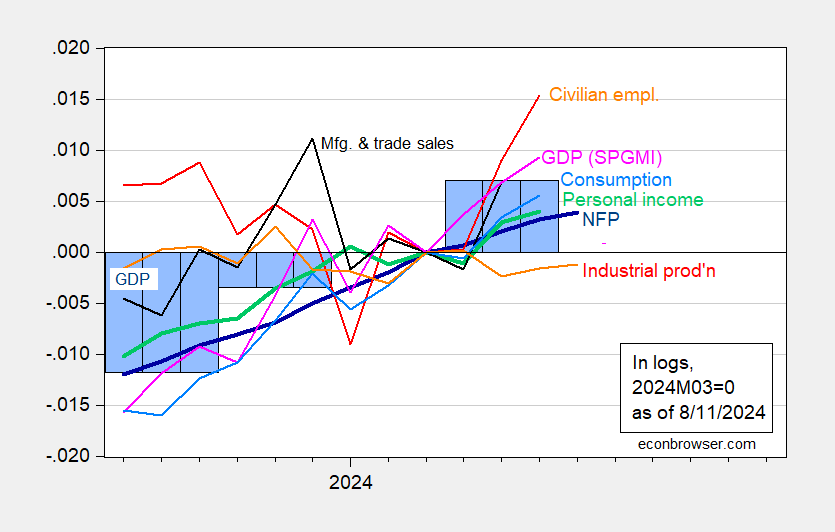
Figure 1: Nonfarm Payroll (NFP) employment from CES (bold blue), civilian employment (orange), industrial production (red), personal income excluding current transfers in Ch.2017$ (bold green), manufacturing and trade sales in Ch.2017$ (black), consumption in Ch.2017$ (light blue), and monthly GDP in Ch.2017$ (pink), GDP (blue bars), all log normalized to 2023M04=0. Source: BLS via FRED, Federal Reserve, BEA 2024Q2 advance release, S&P Global Market Insights (nee Macroeconomic Advisers, IHS Markit) (8/1/2024 release), and author’s calculations.
And alternative indicators:
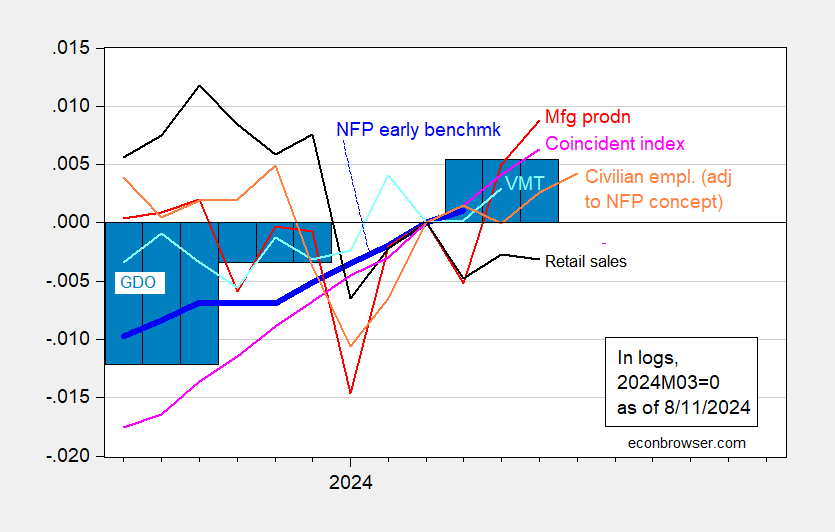
Figure 2: Nonfarm Payroll (NFP) employment Philadelphia Fed early benchmark (bold blue), civilian employment adjusted to NFP concept (orange), manufacturing production (red), retail sales (black), vehicle miles traveled (light blue), and Coincident Index (light pink), GDO (blue bars), all log normalized to 2023M04=0. GDI used in calculating GDO for 2024Q2 estimated by predicting 2024Q2 net operating surplus using GDP, lagged surplus, lagged differenced surplus, 2021Q1-2024Q1.Source: BLS via FRED, Federal Reserve, BEA 2024Q2 advance release, Philadelphia Fed, and author’s calculations.
Of course, all these series will be revised to varying degrees, with GDP being the series at greatest risk — which is why NBER’s BCDC doesn’t put primary weight on it.
More By This Author:
High Frequency Recession Indicators“Mandate For Leadership” (aka Project 2025) On Trade Policy: The Case For Fair Trade
Revisiting The Recession Call Of 2022H1


Comments
Log in or sign up to join the conversation.