
Are Private Equity Valuations Too High?
Some investors are concerned that private equity valuations are too high. The Dow fell 8.8% in 2022, while the S&P 500 and the MSCI World each fell around 18%.

Using our Daily Valuation Engine, we estimate that when GPs issue their 4Q23 reports, private equity will be down 6.9% on the year.[i] That listed markets have been significantly more volatile makes the relative tranquility of private equity seem unlikely, and a bit off-putting to skeptics.
Some would say that private equity, with its smaller companies and higher gearing, should be more sensitive to swings in the public markets, and thus GPs are reporting inflated valuations for their portfolios. We decided to look at the data to see whether they support this instinct about private equity valuations.
Spoiler Alert: We think valuations are probably about right.
Drawing from SPI and Omni, we looked at the TEV/EBITDA multiples implied by carrying values for buyout transactions over the last five years.[ii] Each period contains between 319 and 2,777 companies; the last period contains the fewest observations since many GPs had not reported as of this writing.
As seen in Figure 1, average private equity valuation multiples exceeded the S&P 500 in the second and third quarters of last year, although median multiples were in line. There are clearly some outlier companies skewing the average, but in general valuations do look higher than normal relative to the S&P, but not wildly overvalued.
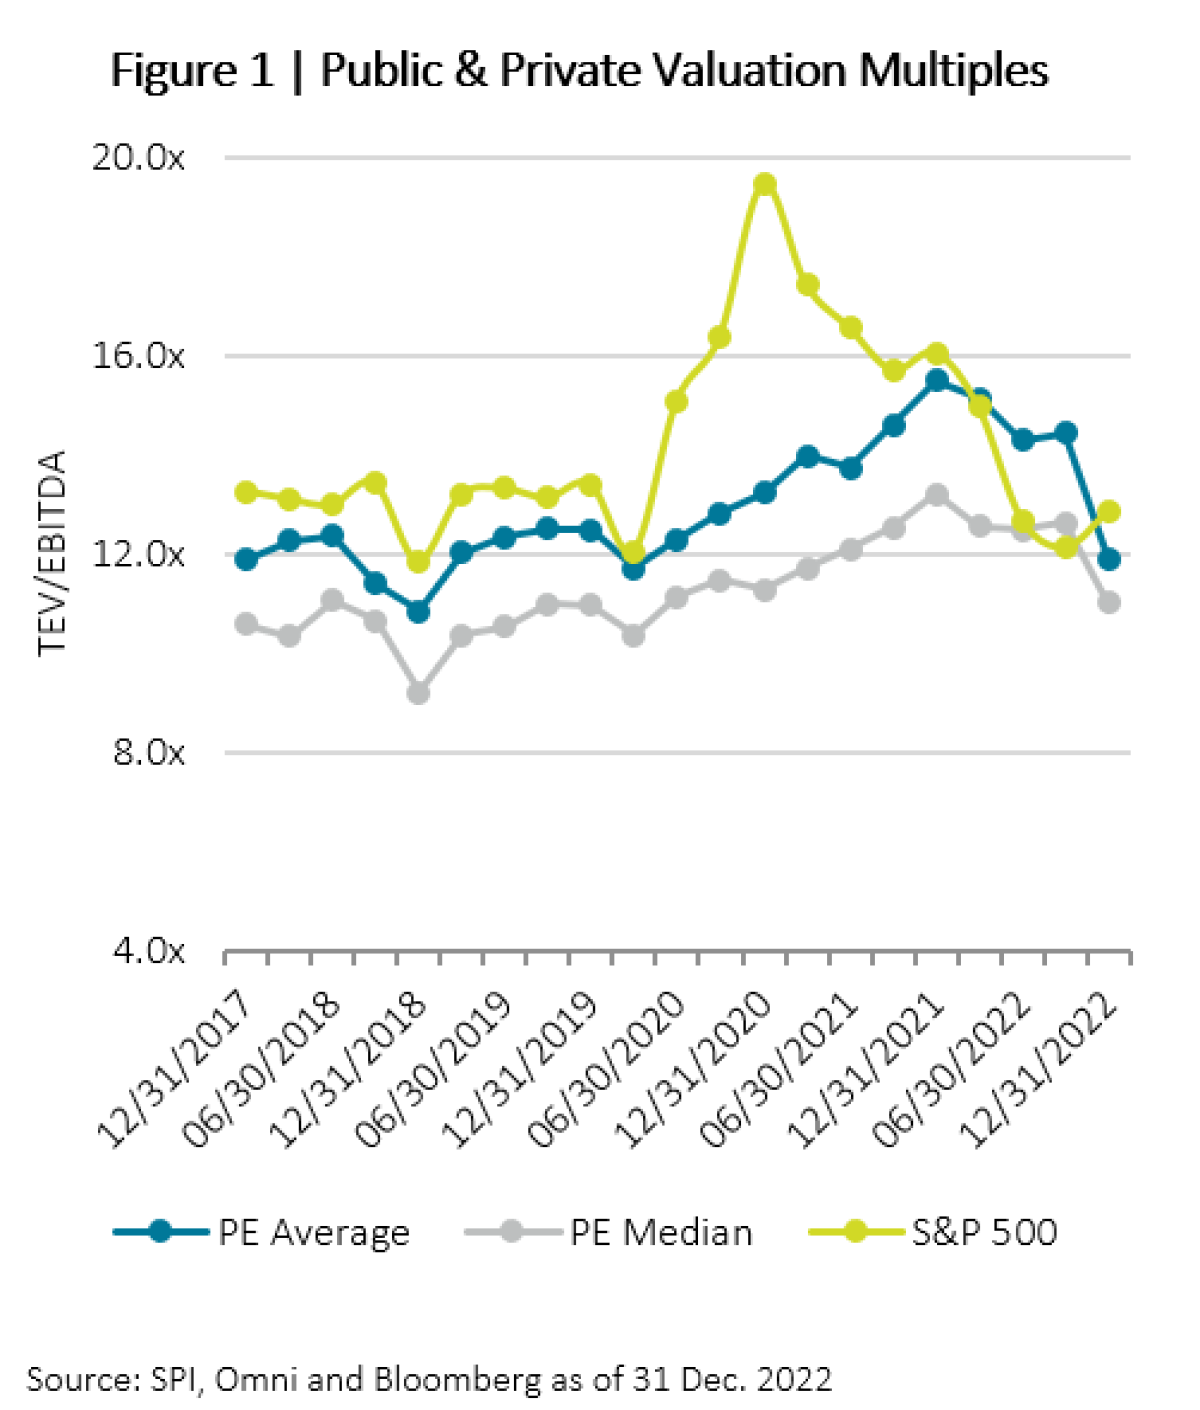
Source: SPI, Omni and Bloomberg as of 31 Dec. 2022
How afraid should we be about these elevated multiples? We can be concerned about the impact on returns to existing investments; we can also ask what it might mean for new capital deployed into the asset class. To examine the potential impact on existing portfolios, we look at the past behavior of GPs in valuing their companies. If multiple expansion is an important part of return generation, then we could be in for lower returns going forward.
We looked at 2,291 buyout deals completed between March 2000 and September 2007, representing the peak of the Dot-Com Boom to the subsequent peak prior to the GFC—the “Golden Age” of private equity—and 909 deals done from January 2015 to present (the “Current Cycle”). The dataset consists solely of deals that are at least 80% realized, to ensure that we weren’t capturing stale valuations.
During the Golden Age yields on the 30-year treasuries moved from just under 6% to about 4.5%, while in the Current Cycle yields have moved from 2.75% to a low of about 1.5%, before rebounding to about 3.75%. Our analysis looked at changes in operating metrics and capital structure to attribute changes in unlevered value to either earnings growth or multiple expansion.
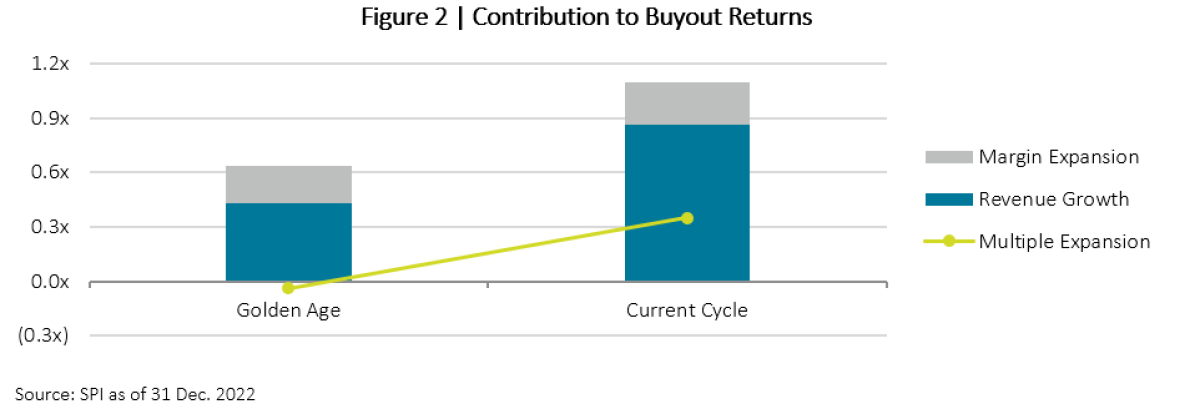
To be fair, in the Current Cycle, GPs have benefitted from multiple expansion. But this “rising tide” contributed far less to private equity outperformance than one might think. In fact, revenue growth and margin expansion provided about 300% more unlevered value creation than multiple expansion (Figure 2). In other words, earnings growth—the combination of revenue growth and margin expansion—was significantly more important than multiples for increases in value of realized companies.
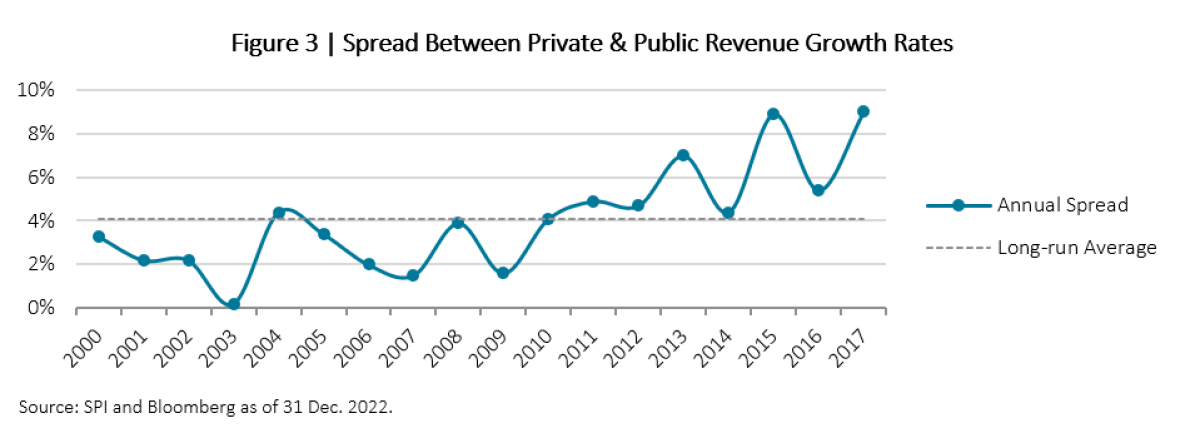
We wanted to look at this growth in comparison to public markets to see if private equity growth rates are really that exceptional in an economy that has seen fairly strong growth across the board. So, we compared private equity revenue growth rates to growth in revenue per share of the S&P 500 during the holding period of transactions in a variety of vintage years. As seen in Figure 3, on average private equity revenue grew 4.1% each year more than the S&P 500. This spread widened in more recent years.
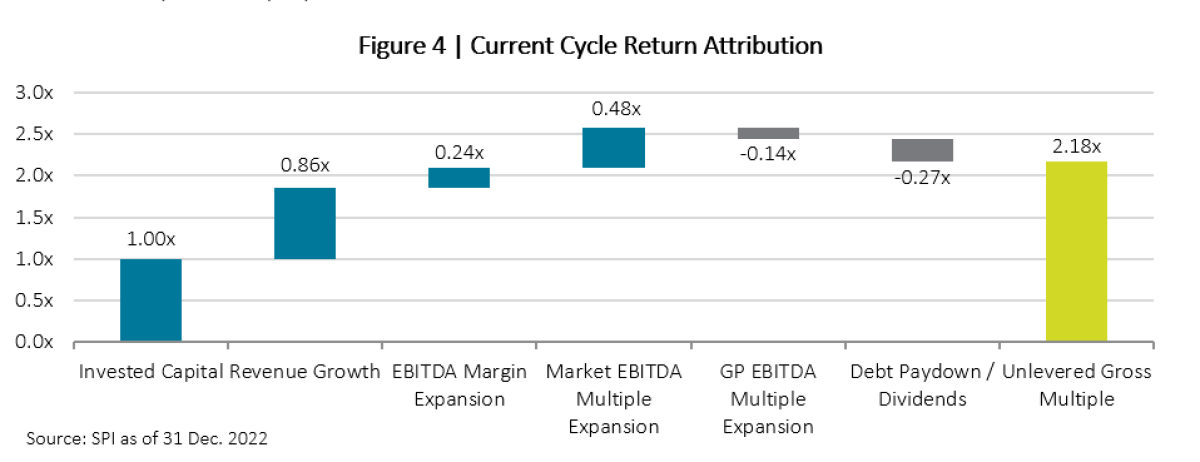
We dug a bit deeper into the “rising tide” phenomenon by comparing multiple expansion observed in the public markets to that of private equity.
As seen in Figure 4, in the Current Cycle, the negative GP Multiple Expansion suggests that private equity multiples have increased less than those of like-vintage public equities (between the time a GP buys and sells a company). In other words, public markets have benefitted more from the exuberance in the capital markets than private equity GPs.[iii]
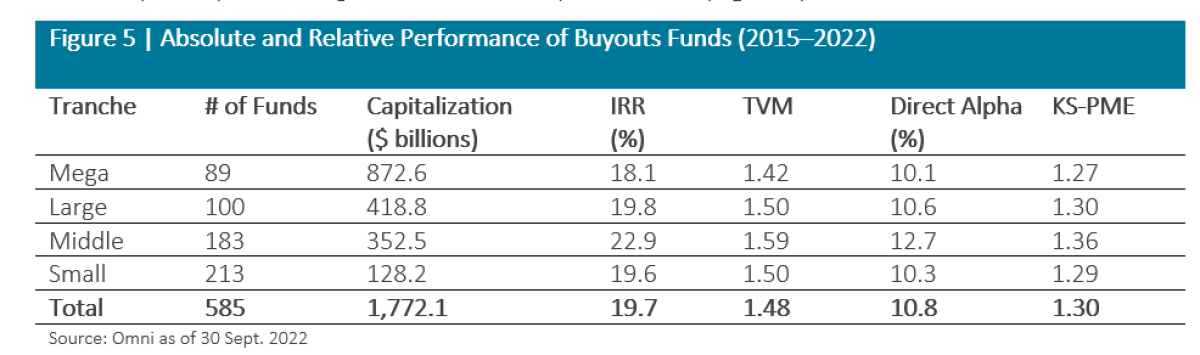
Despite this, private equity has outperformed the S&P 500 by a wide margin over the past seven vintages: Current Cycle buyout funds generated a direct alpha of 10.8% (Figure 5).
Based on our analysis, private equity outperformance has been attributable to things other than multiple expansion (e.g., revenue growth and deleveraging). So it is reasonable to conclude that even if public valuations are more favorable today, existing private equity investments may outperform the public markets going forward.
Implicit in the concern about private equity valuations is the idea that GPs game the system to inflate valuations. If this behavior is typical, we would expect to see little appreciation in value over the final year or so of investment. StepStone’s secondary team developed a tool to look at the behavior of GPs, to capture information about any tendency to under- or overvalue investments. This tool measures the typical uplift (or contraction) in valuations for a particular GP in the quarters leading up to an exit.
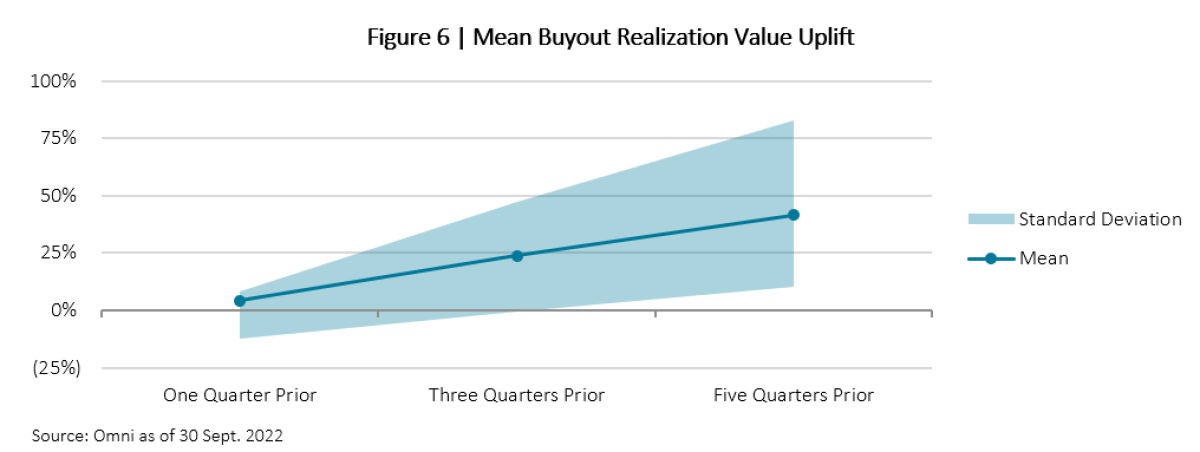
Looking at 2,406 exits across more than 100 GPs, we determined that the average exit is realized at a premium of 24% to the carrying value three quarters prior, and 42% above the carrying value five quarters prior (Figure 6). Exit value is typically approximated one quarter before realization as GPs will be in the late stages of a sale process with a clear line of sight to terminal value. This means that in the year before marking at the realized value, the typical portfolio company appreciates about 40%—roughly 2.0–2.5 times faster than the typical gross IRR for a buyout deal. This indicates that rather than writing up multiples early in a deal’s life, GPs tend to be more conservative over the hold period until the last few months of a deal’s life. This is further evidence that concerns about GPs overestimating the carrying value of their companies may be a bit exaggerated.
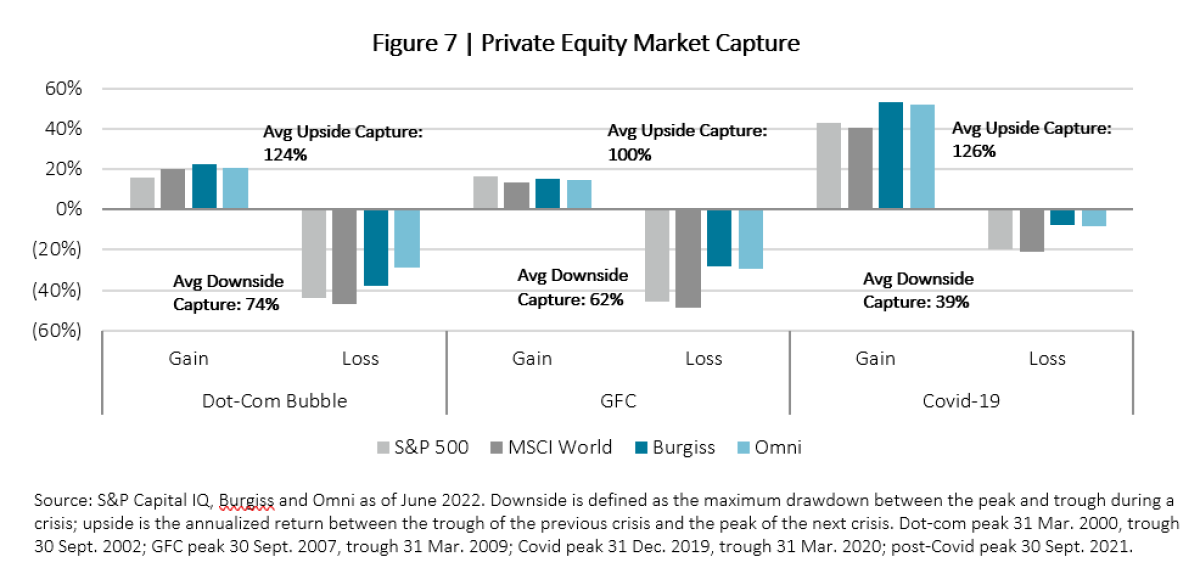
If interim valuations were significant to the overall returns of private equity, then we would see evidence of it in looking at returns throughout a public market cycle. Public markets fall farther in a downturn; if private markets eventually catch up, we should see evidence of underperformance as public markets move from their nadir to their next peak. As Figure 7 demonstrates, however, we have not seen this pattern emerge. While GPs do not mark their portfolios down to the full extent that listed markets decline, they do take advantage when the listed markets are exuberant. This has historically allowed GPs to capture less downside while benefitting from all or more of the upside in listed markets.
The key takeaways so far are that:
- Evidence doesn’t support the assertion that private equity valuations are wildly out of line so we should not expect a period of underperformance; and
- Private equity is less about valuation arbitrage than it is about P&L improvement and deleveraging.
There is much more we could talk about—the attractiveness of secondaries, the compelling opportunities to commit to previously oversubscribed GPs, and even the opportunities presented by new evergreen products. Those are longer conversations worth having but beyond the scope of this note.
The last thing we want to leave you with is an enduring lesson that was reiterated in a 2020 paper by Steve Kaplan and Greg Brown.[1] They found that timing private equity is difficult and that the optimal strategy—in the absence of perfect information ex ante—is a “steady as she goes,” consistent commitment to the asset class.
StepStone (STEP) believes that concerns about potential underperformance due to elevated valuations in private markets are misplaced. Private equity skeptics have consistently tried to raise doubts about how GPs value their investments. We think it is important to listen to skeptics, but we always want to look for evidence that supports or refutes their arguments. Access to data and information is an unfair advantage to investing in private markets, and our data indicate that concerns about private valuations are misplaced and that 2023 has the potential to be an excellent time to gain exposure to the asset class.
Footnotes:
[i] Our “DVE” incorporates information from public markets with everything that is known about a private equity portfolio to give a real-time estimate of what GP valuations would be if they were available.
[ii] We draw heavily on Omni, our portfolio monitoring tool and SPI, our proprietary private markets library. As of 31 December 2022, Omni garnered performance data on nearly 150,000 portfolio investments across nearly 8,600 funds; SPI had information on more than 15,000 GPs and 42,000 funds covering more than 190,000 investments.
[iii] Private equity benefitted from multiple expansion, but to a lesser extent than the public markets. Thus the GP Multiple Expansion looks negative compared with public markets, even though it was a net positive over the holding period.
[iv] Gregory Brown, Robert S Harris, Wendy Hu, Tim Jenkinson, Steven N. Kaplan, David T. Robinson. 2020. “Can Investors Time Their Exposure to Private Equity?” National Bureau of Economic Research, February.
More By This Author:
The ETF CrusadesManufactured Housing: Predictable Top Line, But Operating Expenses Reset
A Couple Of Tough Weeks For Hedge Funds
Disclosure: StepStone Group is a global private markets investment firm focused on providing customized investment solutions and advisory and data services to our ...
more

