
Both production and sales below m/m consensus.
(Click on image to enlarge)
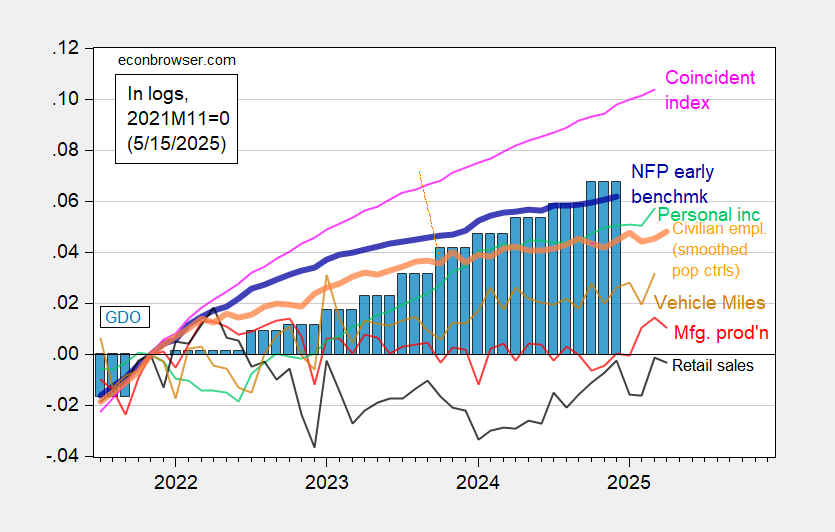
Figure 1: Implied Nonfarm Payroll early benchmark (NFP) (bold blue), civilian employment adjusted smoothed population controls (bold orange), manufacturing production (red), personal income excluding current transfers in Ch.2017$ (bold green), real retail sales (black), vehicle miles traveled (tan), and coincident index in Ch.2017$ (pink), GDO (blue bars), all log normalized to 2021M11=0. Source: Philadelphia Fed [1], Philadelphia Fed [2], Federal Reserve via FRED, BEA 2025Q1 advance release, and author’s calculations.
For NBER Business Cycle Dating Committee indicators, see this post.
More By This Author:
Business Cycle Indicators As Of Mid-May; Manufacturing Contracts In “Liberation” Month
Why I Think Economic Policy Uncertainty Is Likely to Stay High
Economic Policy Uncertainty Since 1985, Impact On GDP


Comments
Log in or sign up to join the conversation.