

Monthly data, with May through the 13th.
(Click on image to enlarge)

Figure 1: EPU-News, average of daily data (blue). May observation through 13th. Standard deviation of log EPU pertains to monthly data, 1985-2024. NBER defined peak-to-trough recession dates shaded gray. Source: policyuncertainty.com, NBER, and author’s calculations.
Since February, the log EPU has moved about two standard deviations. According to Torsten Slok, this amounts to…
(Click on image to enlarge)
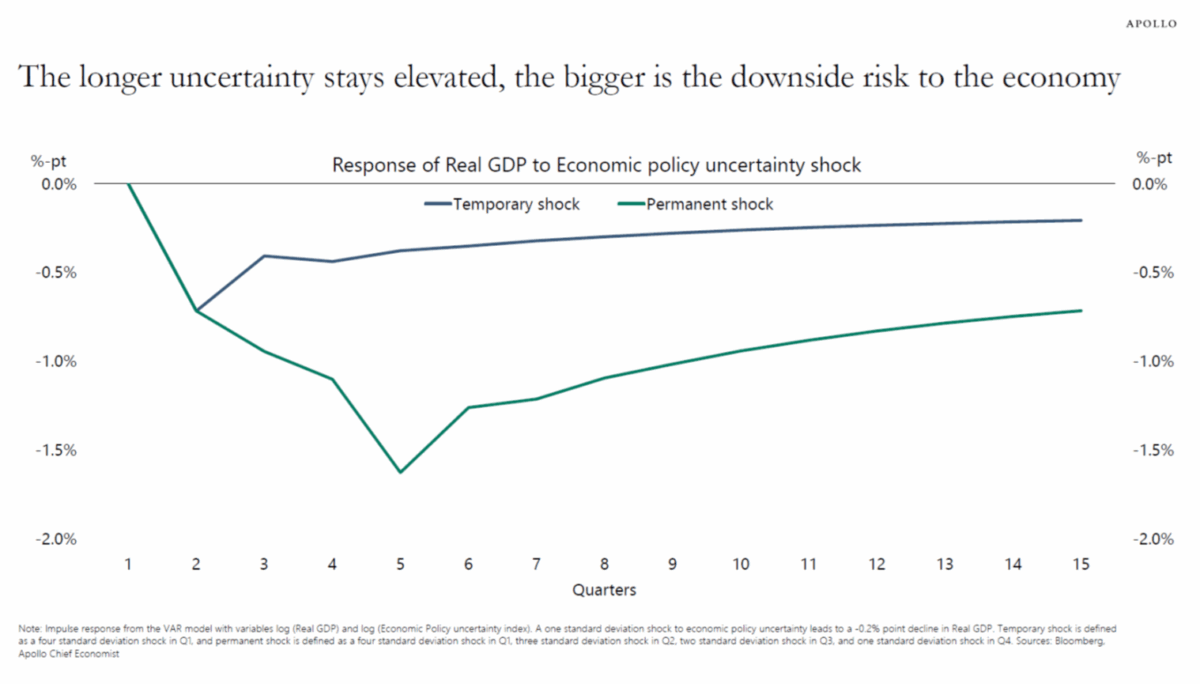
Notes: Impulse response from the VAR model with variables log (Real GDP) and log (Economic Policy uncertainty index). A one standard deviation shock to economic policy uncertainty leads to a -0.2% point decline in Real GDP. Temporary shock is defined as a four standard deviation shock in Q1, and permanent shock is defined as a four standard deviation shock in Q1, three standard deviation shock in Q2, two standard deviation shock in Q3, and one standard deviation shock in Q4. Sources: Bloomberg, Apollo Chief Economist. April 1, 2025. Source: Slok, Apollo, April 1, 2025.
More By This Author:
Economic Policy Uncertainty UpMomentum In “Core” GDP
Business Cycle Indicators - Tuesday, May 6


Comments
Log in or sign up to join the conversation.