
Industrial and manufacturing production downside surprises.
(Click on image to enlarge)
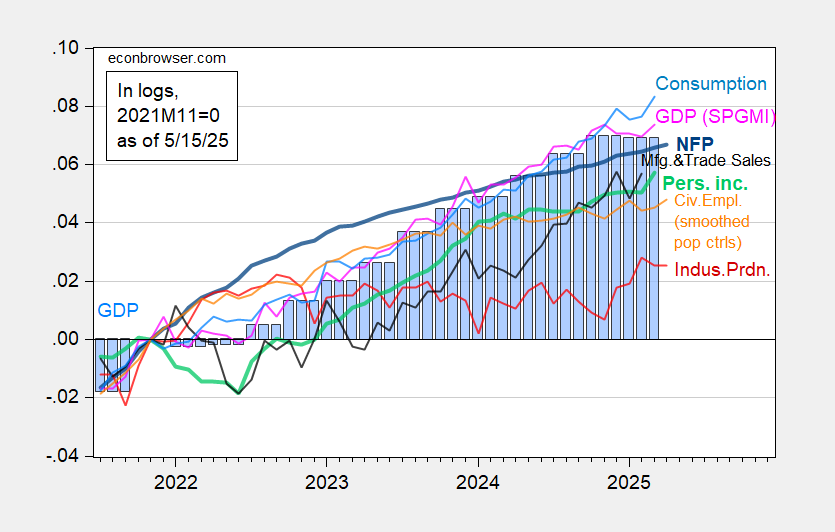
Figure 1: Nonfarm Payroll incl benchmark revision employment from CES (bold blue), implied NFP from preliminary benchmark through December (thin blue), civilian employment as reported (orange), industrial production (red), personal income excluding current transfers in Ch.2017$ (bold light green), manufacturing and trade sales in Ch.2017$ (black), consumption in Ch.2017$ (light blue), and monthly GDP in Ch.2017$ (pink), GDP (blue bars), all log normalized to 2021M11=0. 2025Q1 GDP is advance release. Source: BLS via FRED, Federal Reserve, BEA, S&P Global Market Insights (nee Macroeconomic Advisers, IHS Markit) (5/1/2025 release), and author’s calculations.
Manufacturing index down -0.4% m/m, compared to -0.2% consensus.
(Click on image to enlarge)
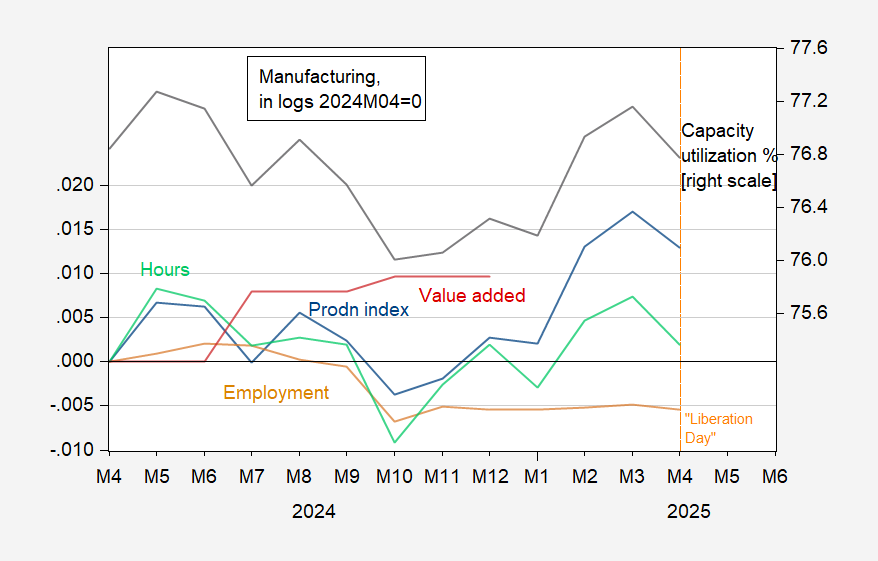
Figure 2: Manufacturing production (blue), value added in 2017$ (red), production and nonsupervisory worker employment (tan), hours (light green) all in logs, 2024M04=0; and capacity utilization (NAICS), % (black, right scale). Aggregate hours of production workers calculated by multiplying average weekly hours by employees. Source: Federal Reserve, BEA, BLS, and author’s calculations.
More By This Author:
Why I Think Economic Policy Uncertainty Is Likely to Stay HighEconomic Policy Uncertainty Since 1985, Impact On GDP
Economic Policy Uncertainty Up


Comments
Log in or sign up to join the conversation.