
A Check-Up On The 'Screws" Holding The Economy Together

Image Source: Pixabay
In our July 2025 article (here) when we last checked on the economic screws, we stated…
So far, tariffs have been repeatedly delayed—only around $20B/month has been collected—and net money-creation continues at a higher rate than last year. Although the BBB spending bill removes resources from the poor and gives them to the rich, the increased deficit-spending ($5T over 10-years) should support the stock market and keep the primary bull trend in place over the next year.
Six-months later, the tariffs have been running at twice what they were in July (~$40B/month) and DOGE has been disbanded with no accounting of the cuts that were achieved or when the effect of the cuts would show up. The BBB (Big Beautiful Bill) does not come into effect until the New Year ( Government spending at this point is unchanged year-over-year) and will bring both tax-cuts ($5T) for the rich and spending cuts for the poor in the form of reduced health insurance assistance and other support agency spending. These uncertainties make predicting the next 6-12 months in the economy much less certain, but in this article we will check on the current state of the "screws" that hold the economy together.
The Screws Holding the Economy Together
The first chart below is the BaR grid (from econ p.i.) dated June 27, 2025 and the second chart is the most recent dated Dec. 19, 2025.

econ p.i.

econ p.i.
Notice that the MoC (mean of coordinates) has moved out of the expansion quadrant and into the decline quadrant, while the WMoC (weighted mean of coordinates) and the LD (leading indicators) have both weakened their positioning. This means that the average of economic measures have weakened and are no longer growing. This screw is a little loose.
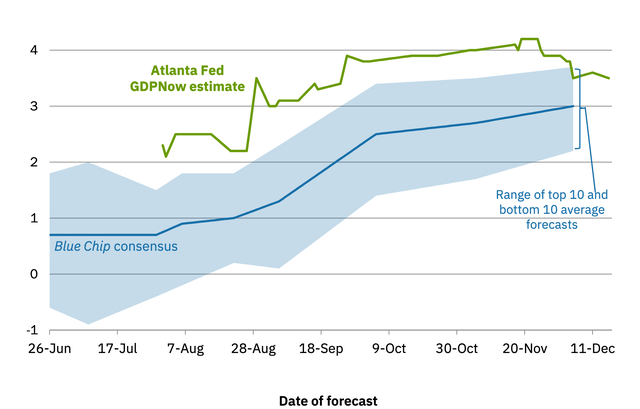
The GDPNow estimate of Q2 2025 is averaging 3.5% (compared to 2.5% last July). This screw is tight (chart below).
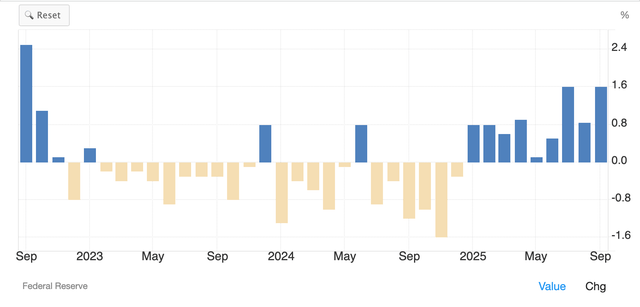
Industrial Production of the United States has increased since the start of 2025. This screw is tight (chart below).
Capacity utilization either stalls or drops ahead of recessions. However, it is a necessary condition, not a sufficient condition for a recession; no recessions resulted following the drops in capacity utilization in 1985, 1995, 1997, and 2015. Capacity utilization has been decreasing, making this screw looser than we would like to see.
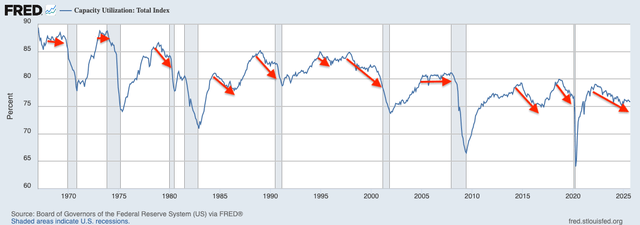
FRED
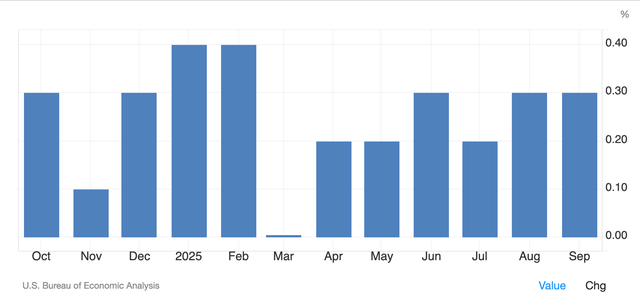
PCE (personal consumption expense), which is the Fed's preferred gauge of inflation, has been steady since June. This screw is tight enough (chart below).
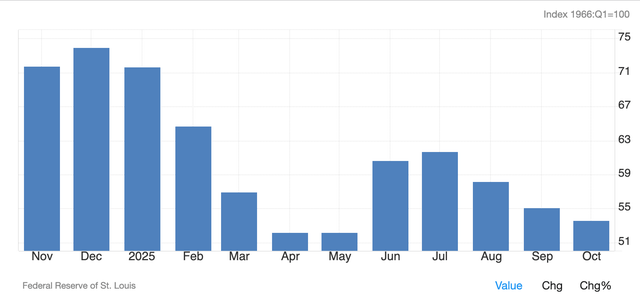
The University of Michigan consumer sentiment for the US has been trending lower since July. This screw is loose.
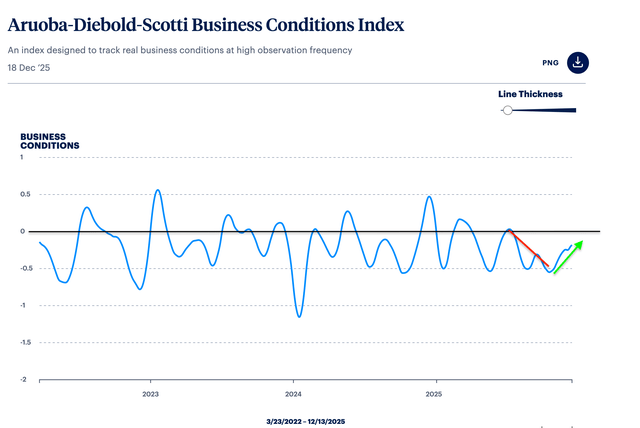
The Aruoba-Diebold-Scotti business conditions index is designed to track real business conditions at high frequency. The average value of the ADS index is zero. Bigger positive values indicate progressively better-than-average conditions, and bigger negative values indicate progressively worse than average conditions. The index shows that business conditions are still slightly worse than average, but have improved recently (green arrow) which makes it a tightening economic screw (chart below).
Initial jobless claims [blue] rise for a year ahead of recessions, while business activity [red] falls (chart below).
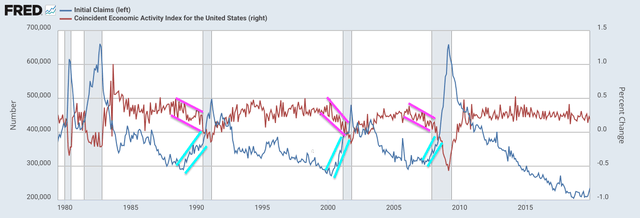
FRED
Since 2022, initial claims and business activity have been stable. These are both tight economic screws at this point (chart below).
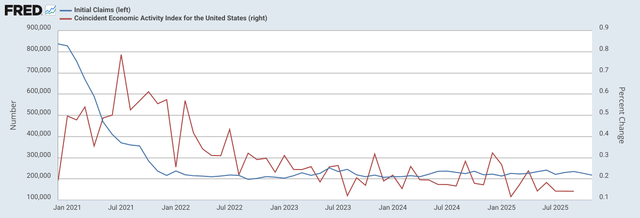
FRED
The Manufacturing PMI for the US continues to grow (above 50), but at a reduced rate over the past 3-months. This screw remains tight enough (chart below).
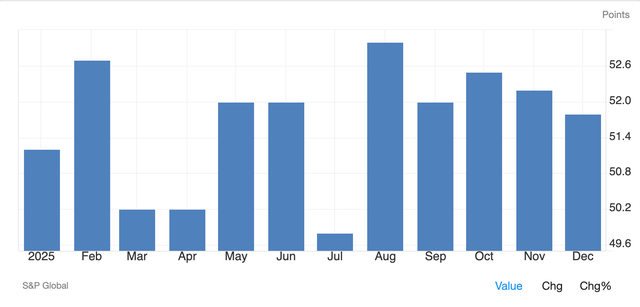
Tradingeconomics
The Services PMI continues to grow (above 50), but at a reduced rate over the past 3-months. This screw is still tight enough, but getting looser (chart below).
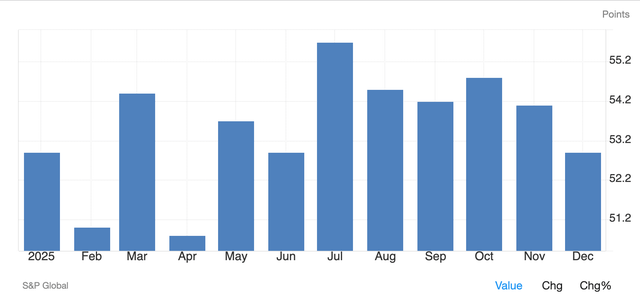
Tradingeconomics
Banks tightening lending-standards always precedes recessions (red-lines below), but tightening lending-standards does not always lead to recessions (purple-lines below); e.g., 1994-1999 and 2014-2016, and 2021-2022. Lending-standards continue to be relaxed (green-line below). This screw is tight.
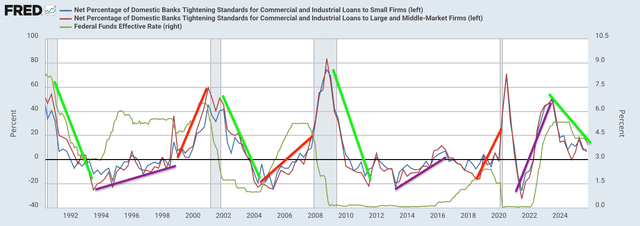
FRED
Recessions occur when loan delinquency-rates are rising, and when Household debt service as a percent of disposable income becomes elevated. Currently, both measures are just above historically low levels. This screw is tight.
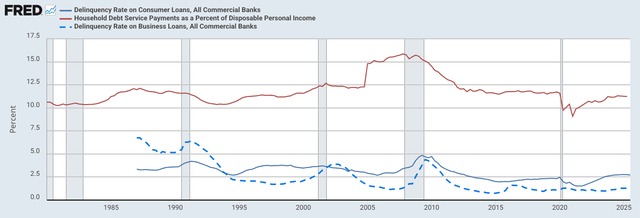
FRED
Recessions are always preceded by at least two-years of falling housing starts. Housing starts has been falling since 2022. This screw is loose.
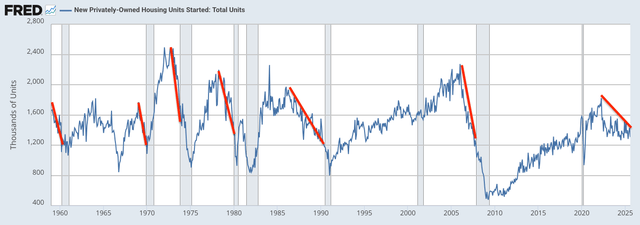
FRED
Truck transport employment (blue-line below) stops growing or declines, and heavy truck sales (red-line) collapse for more than a year ahead of recessions--the exception being 2015-2017 (pink-rectangle below). Truck transport employment has come down from the all-time highs of 2023 (blue-highlight) and truck sales have dropped below the up-trend line (black). This is a dangerously loose economic screw.
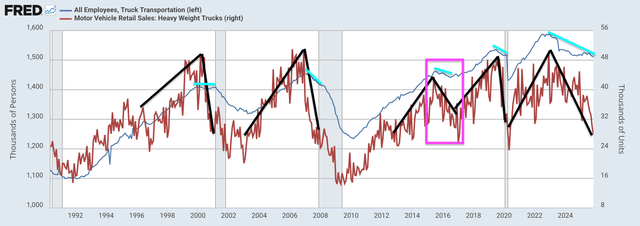
FRED
Corporate profits tend to decline (red), sometimes for years, ahead of recessions. Profits continue to rise from the pandemic lows. This is a tight screw.
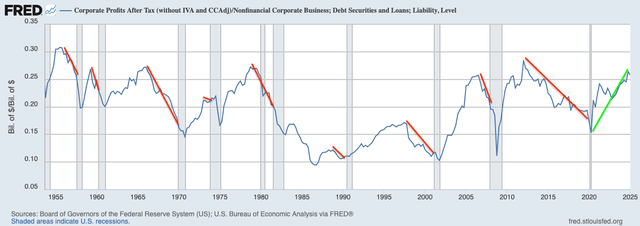
FRED
The Most Important Screw of All
Money drives both the economy and the stock market, but most people simply do not understand what money is or where it comes from.
Money can be anything that we agree is capable of releasing real-resources, like labor and materials. It is not a physical entity, and today's money is not fixed to anything physical; Richard Nixon took the US dollar off the gold-standard in 1971. The US dollar is created by Congressional spending-laws, and is destroyed by taxation: by-the-way, taxation is what forces everyone in the US to use the US dollar as currency. Taxpayers need to earn US dollars before they can pay their taxes. Taxpayers cannot create US dollars—that would be counterfeiting. All US dollars are created by Government spending. The Federal Government is "self-funding."
Net spending is the difference between nominal-spending and taxation. If the Government spends (creates) more US dollars than it taxes back, then we say it has a deficit; it has deposited more money in private bank accounts than it has taxed back.
Government deficit = private surplus
Government deficits correlate positively with the SPX (chart below). This makes sense, since bigger economies (and higher stock markets) require more money in the system.
So far, the fiscal-2026 (started Oct. 1/25) annualized run-rates of the deficit and of the net money-creation (which includes bank credit creation) are lower than in any year since 2022 (chart below).
This is a loose screw, but it is still early in the fiscal-year and the BBB takes effect in the new calendar-year with a potential $5T increase to the money supply (by way of tax-cuts), and if the tariff taxes are stopped or (better yet) refunded, then the improved fund-flows would tighten the "deficit-spending screw" which would support the economy and the stock market.
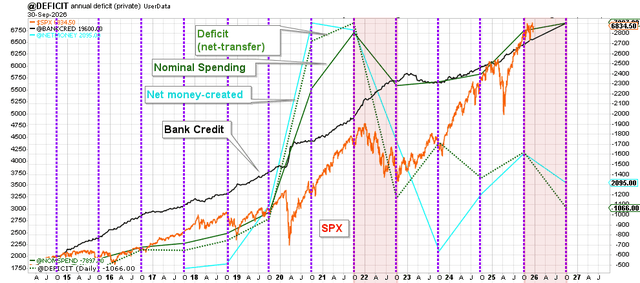
ANG Traders
In conclusion, 60% of the economic screws are tight, and as long as the BBB's tax-cuts take effect in January, many of the loose screws will tighten--starting with net money-creation-- making a recession in the next 6-12 months unlikely. However, if the deficit and net money-creation continue to slow then the economy and the stock market will stall and recession and a bear market become more likely.
More By This Author:
The Future Of The Stock Market Is Written By The Net Money-Creation
What Is Obvious...is Obviously Wrong
How The Market Behaved During Past Government Shutdowns
ANG Traders makes no guarantees concerning the profitability of our trades. Our trade notification service is not intended as investment advice in any way. It is simply providing information about ...
more

