Tuesday Talk: Tread, Turmoil And Churn
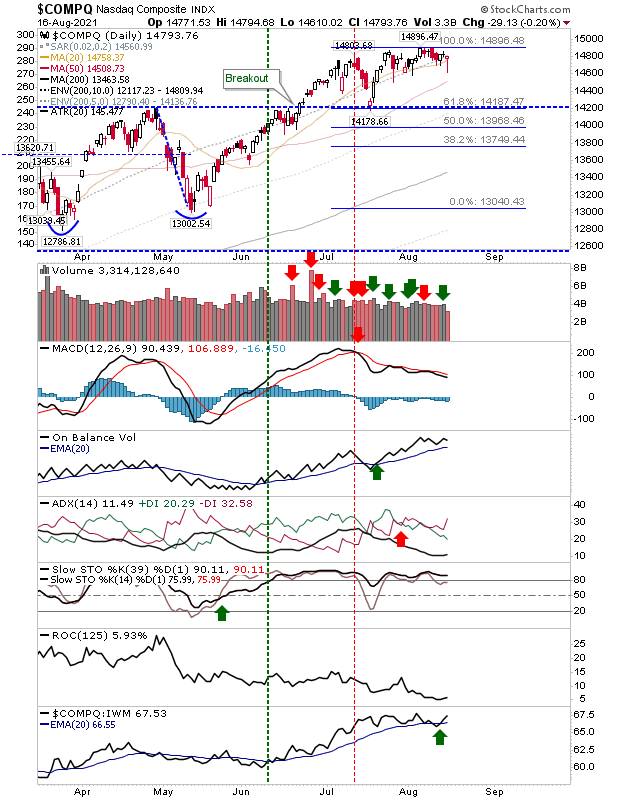
Amidst the tumultuous headlines coming from Afghanistan, the markets maintained their slightly upward churns on Monday. The S&P 500 closed at 4,480, up 0.26%, the Dow closed at 35,625, up 0.31% and the Nasdaq Composite closed at 14,794, down 0.2%. Asian markets are trading down today, but the European markets are up. Currently S&P futures are trading 20 points lower, Dow futures are trading 200 points lower and Nasdaq futures are trading 59 points lower. The morning NYT headline reads, "Race to Evacuate Continues in Afghanistan".

TalkMarkets contributor Kelsey Williams in his TM exclusive article The Rise And Fall Of Gold Stocks reviews how gold stocks underperform to gold itself over time. Here are a few of his observations:
"The rise and fall of gold stocks is a story of hurt and disappointment. That is because most of the time gold stocks are in decline...If you are speculating on new highs for gold and want to own it, then buy it. Don't expect gold shares to outperform gold itself.

If you own gold stocks, consider switching to physical gold or a gold ETF (GLD). If you are gambling on a reversal of the current trend, or you are just stubborn, you need to be prepared for the possibility (likelihood?) of a near-term drop in gold-stock prices of 20-25 percent."
Check out the article for Williams' accompanying set of charts which graphically illustrate the story.
Steven Saville sifts through current economic data in Signaling A Boom-To-Bust Transition looking for signs of an impending bust to the current boom. He notes there are two significant indicators of an impending bust, "One is a clear-cut widening of credit spreads. The other is pronounced weakness in the Industrial Metals Index (GYX) relative to the gold price. These indicators have been known to generate false positives, meaning that there have been times when they have warned incorrectly that a bust was about to begin."
Saville takes us through his methodology for searching out the signals, but spoiler alert, he comes up empty handed. "Economic growth and confidence have declined a little over the past two months and it’s possible that the decline will become more pronounced over the coming two months, all within the context of a boom that currently shows no signs of ending."
He provides the following definition of boom and bust, which may be worth keeping in your back pocket.
"A boom is defined as a period lasting 2-3 years or longer during which monetary inflation creates the illusion of robust economic progress. A bust is a period usually lasting 1-3 years during which the mal-investments of the boom are liquidated, leading to general economic hardship. Bust periods sometimes, but not always, contain official recessions."

TalkMarkets contributor Chris Vermeulen (who looks at the markets from a technical point of view) in his article Surprising Consumer Activity May Suggest A Deeper Shift In The Markets posits that:
"The deep decline in the US and global economic indicators, as a result of the COVID-19 shutdown, prompted an incredible recovery rally phase in the markets that had everyone chasing the uptrend in stocks, housing prices, and other assets. Now that we are beyond 15+ months after the March 2020 COVID lows, a new dynamic may be setting up in the markets."
Vermeulen suggests that we should be on the lookout for "a “Dampening Sine Wave”. This process may prompt a fairly big downward economic trend resulting from Month-over-Month and Year-over-Year data trending lower for the next 6 to 12+ months as the data shifts throughout the Sine Wave process."
See his chart below:

"As time progresses forward, we will see the trends roll over the June/July peak in this Sine Wave process and begin to move downward. This will shift how consumers perceive global market trends and will shift how economic data is being reported. What was very strong growth, inflation, and economic data will shift into weaker trends and an eventual downtrend as the Month-over-Month and Year-over-Year data shifts forward."
Vermeulen strongly cautions that "(It is) our belief that the Dampening Sine Wave process is continuing to unfold. This means traders and investors need to be prepared for extreme volatility events over the next 12 to 24+ months and be ever cautious of any new external economic crisis events. These external events may prompt an increase in the Amplitude and structure of the Dampening Sine wave process and could completely disrupt the global market recovery process taking place right now."
Check out the full article for a more in depth look.
Circling back to Monday's action Declan Fallon gives his assessment in Stronger Bullish Action For The Nasdaq And S&P As Russell 2000 Suffers Again.
"Sellers tried to put the squeeze on the indices with a large intraday swing lower, but by the close of business, those losses were recovered for some of the indices. The Nasdaq (COMP) had undercut its 20-day MA with a quick loss, but it recovered to finish with a 'bullish' hammer."

"The S&P (SPX) had flashed a sequence of narrow, tight-range candlesticks up until today, but today offered a wide range hammer that saw buyers step in to claw back intraday losses. It was enough to leave the index at a new all-time high after looking like it was going to be a confirmed day of selling. Ultimately, it proved to be an accumulation day but overall trading volume was light - in line with vacation trading."

"The Russell 2000 (IWM) gapped below its rising wedge and it remains to be seen if there is a measured move lower down to - and below - trading range support. However, there is a 'sell' trigger in On-Balance-Volume, ADX, and relative performance loss to the Nasdaq...(The losses in the Russell 2000) is more worrying as a move to trading range support would look to be a minimum target and this will have an obvious (negative) knock-on effect on the S&P and Nasdaq."
No trade ideas in the column this week but I will leave you with this somewhat contrarian piece from TalkMarkets contributor John Rubino who poses the question After 50 Years Of Fiat Currency, Guess What Looks Good ?
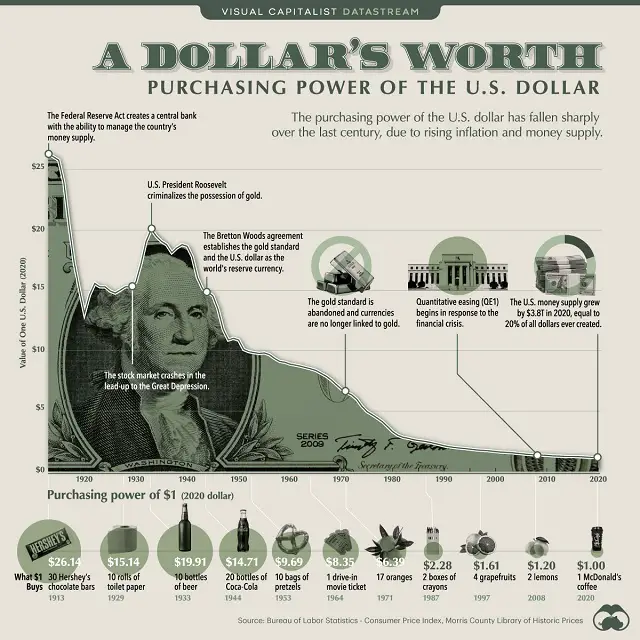
Rubino gives a brief run-thru of how The Fed has managed the USD (UUP, UDN) and starts off with this interesting graphic:

I'm not sure paying $26.14 in 2020 dollars for 30 Hershey bars which would have cost only $1.00 in 1913 is an indication of bungling, and for whoever wants to you can still get a cup of coffee at McDonalds today, for $1.00. However, Rubino (perhaps, echoing Chris Vermeulen) also, looks at consumer sentiment right now and comes up quite concerned:

Adding in post-COVID (?) global supply chain problems to weakening consumer sentiment he concludes with the following:
"And voilà, we’re back in stagflation. Governments then respond in the only way they know, with easier money to relieve the “stag” part of the problem. This ignites a stampede into real assets and sound money.
And there sits gold, cheap in terms of the money supply, other commodities,
and
previous bull markets."

Well maybe, that is a recommendation of sorts after all? Caveat Emptor in that case.
Have a good week (from a personal perspective, from a world view it's going to be a tough one).


My thoughts now are that I am not able to see whatever the responses to my comment are. Or possibly it saw my looking back at my comments as another conmmenting on my comments. Which it was not.
My "consumer Sentiment" is that the Federal Reserve is a bunch of cronies manipulating the economy for their personal benefit, and for their friends benefit as well. The main lie is that inflation benefits all of us. No! Inflation only fails to harm those who are able to conveniently increase their incomes to accomodate inflation. That excludes the vast majority of the world population, not just a large portion of the US population.
As for the value of gold, keep in mind that when the valueof dollaars is only in their heating value if you burn them, GOLD will still work to buy food. So physical gold does have something going for it.