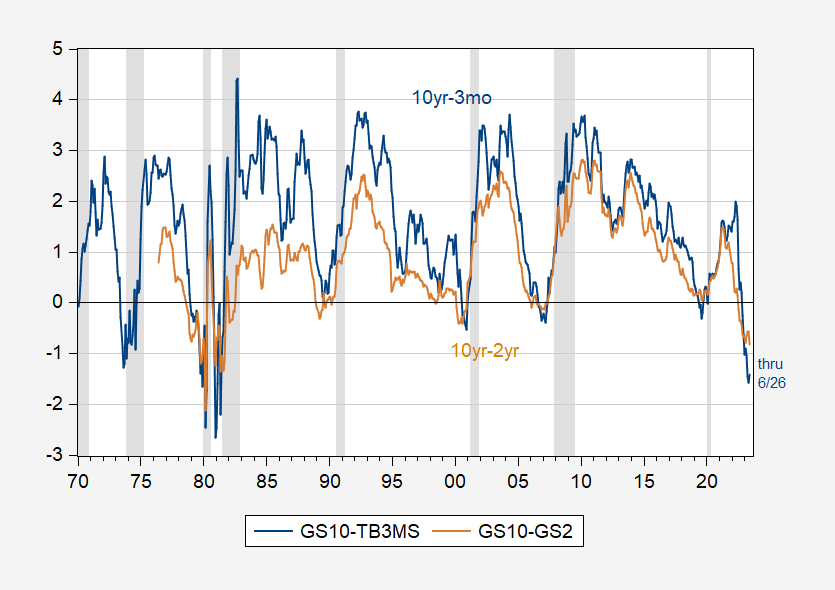
The Term Spread, 1970-2023M06
For reference:
(Click on image to enlarge)

Figure 1: 10 year-3 month Treasury spread (blue), and 10 year – 2 year spread (tan), both in %. NBER defined peak-to-trough recession dates shaded gray. 3 month Treasury is secondary market rate. June observation is for data through 6/16. Source: Treasury via FRED, NBER, and author’s calculations.
Estimated probabilities for 10yr-3mo shown in this post (through May).
Inversions this steep have not occurred for decades. On the other hand, whatever link there is between the depth of inversions and the severity of the recession is not robust.
More By This Author:
Fix the National Debt Without a Magic WandUS-Euro Area Price Level And Inflation Differentials: I(0), I(1), Segmented Trends?
Term Spread Inversion And Non-Inversions
Comments
Please wait...
Comment posted successfully
No Thumbs up yet!


