The State Of The Republic (How The Financial System Works)
Author's Note: I broadcast this video to the world last night.
(Yes, the flag was fixed after a mirroring incident). There’s no selling. Just an urgent communication on how the financial system works. Here is the transcript with charts, slides, and other visuals for anyone who wants to print or share it.
Yes, it’s long. But it’s the only thing you need to read all week. Forgive any transcript errors, as there may be a few updates necessary. Please share insights by replying directly to this email.
Welcome to a very special edition of State of the Republic.
It‘s been a while since I’ve been on air.
As many of you know, I moved to Maryland in May from Florida.
I sold my land. I came here to build a business. I’ve been here for a couple of months.
And I'll be candid with you.
I feel like I was brought up here to sit on a bench and give others my ideas to run them under their name.
I've gotten to a point where I said, “I'm tired of doing this to myself.”
I did this for a decade elsewhere. I don’t want to do this anymore.
So I'm getting off the bench (even without permission) and starting to swing the bat.
I'll start TODAY by talking to you about my worldview.
I’m giving this research away.
I’m just explaining to you what we think about the markets.
I'm not selling you anything. I'm not asking you to purchase anything.
This is 16 years of my life, presented below:
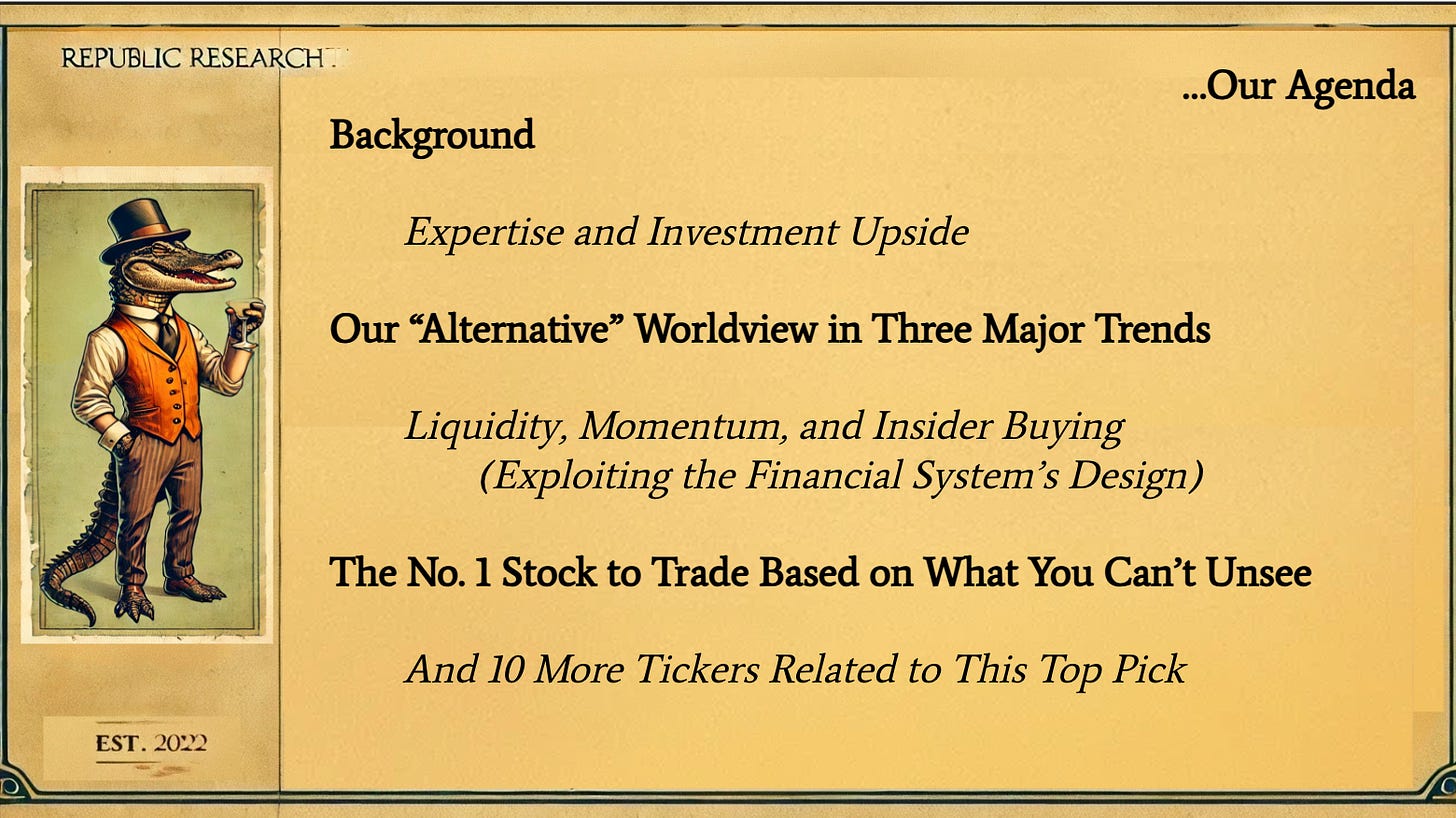
I’ll start with a little background, our expertise, and my upside ideas.
I’ll discuss our alternative worldview and three major trends: global liquidity, reversion momentum, and insider buying.
This entire conversation is about exploiting the financial system's design.
After that, I'll give you the No. 1 stock to trade based on what you cannot unsee.
That ticker is below…
That theme is what you’ll get, too.
The things you can't unsee.
Plus, we're also giving away 10 other tickers with a strong correlation to this stock.
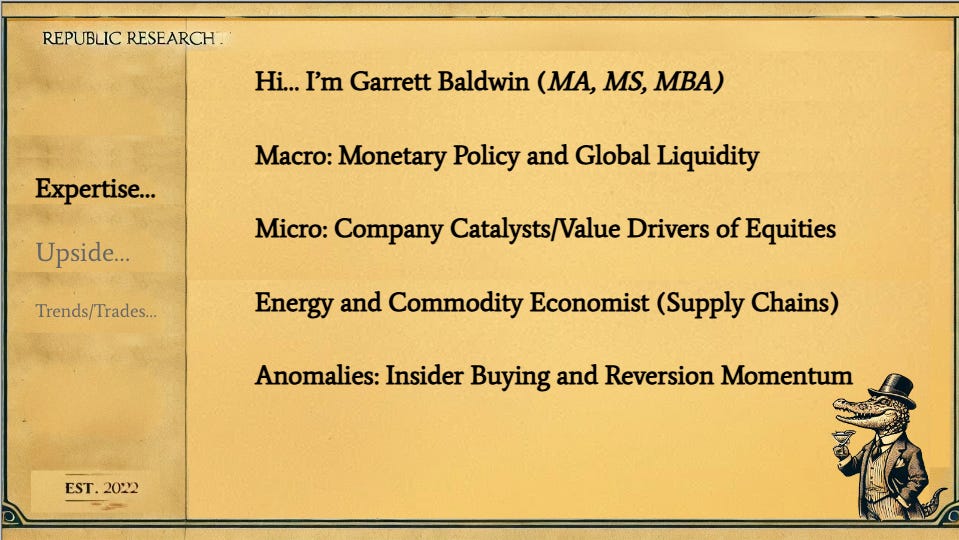
If you don't know me, my name is Garrett Baldwin.
I've worked in finance, economics, and consulting for 20 years.
I have multiple degrees in policy, economics, and finance.
Today's presentation is the summation of that academic and professional work.
I'll explain why I'm doing this - giving it all away - in a moment.
But first, my foci - I study the markets daily - center on four things.
The first is the macro side: monetary policy, central bank policy, and financial crises.
I have a master's degree in economic security from Johns Hopkins University in Washington, D.C. I studied at the School of Advanced Government Studies and took additional classes at the School of Advanced International Studies because the former lacked enough economics professors.
I’m glad it worked out that way.
The best finance professor I ever had was Elie Caneti, the head of the Western Hemisphere of the World Bank. He influenced my understanding of monetary policy at central banks and helped shape my appreciation for country and political risk.
Then, when I thought I understood how the global system worked, I later studied at Harvard Business School Online in the summer of 2018, focusing on global liquidity and cross-border capital flows in a course with Dr. Forest Reinhardt.
That course gave me a different perspective on how money flows internationally… and how it links to the concept of Global Liquidity (more on that in a moment).
Number Two: With an MBA in Finance from Indiana, I center my micro-focus on company catalysts, value drivers, and the things that really facilitate a company's success.
What are the five or six things that really drive customer value and drive shareholder value?
How do we separate real signals in the news from noise in the markets around certain tickers? Events must link directly to the core drivers of a business's success for them to have a meaningful impact on future cash flows and investor excitement.
This is one of the things I highlighted when I gave away my report on Enterprise Product Partners.
I talked about the things that make the company successful.
When you see a headline tied to these value drivers, you know it could catalyze greater shareholder value.
Third: I am a trained energy, agriculture, and commodity economist (I have an MS in Economics from Purdue University). I've done a lot of global supply chain work.
My primary focus is on the midstream of energy and in the downstream of agriculture.
Fourth: We also focus on anomalies, with a heavy span on insider buying and reversion momentum (my core financial analysis work at Indiana)
We're going to talk about both of those things momentarily.
Now - why give away all of this today?
A few reasons.
First. Something happened in the last week that upset me.
A friend of mine had worked on a project for about a year and a half, and he pitched an innovative idea for financial marketing to publishers across America.
It was a phenomenal idea… and it directly aligned with a concept I was developing, a show that positioned me as a pseudo “Anthony Bourdain of Finance and Investing.”
I've wanted to do that for years - investigative work around investing opportunities and narrative storytelling to deliver ideas.
When I got up here, I was excited to shoot these shows and build Republic Research out with these stories as my marketing approach.
Well, I’ve been on the sideline. While he did shoot an episode of his original script, he didn’t get a chance to follow up on his great idea of Fin-tertainment.
Unfortunately, a publishing team to whom he had pitched this concept (and was told it would never work) took his idea and used it.
Why?
Because they could.
I'm not happy about it, and I know he's not happy about it…
But that’s the industry, someone on that team told me.
Well, allow me to get out in front of this.
Before anyone takes this BIG IDEA… I’m giving it away.
I'm going to lay out all of my worldview.
Upload it for free to the world.
And you can replicate it if you want.
This September 15, 2024, presentation sums up all of my academic and financial research since 2008.
Again, this is everything.
I'm not selling you anything.
This is free… because I want you to hear all this from me.
Reason 2: I am also tired of the media narrative.
I went to Northwestern University as an undergrad.
I was a journalism major at Medill.
I know many people in financial media.
I just don't see how the system works.
In my view, the financial system is not complicated. It’s just misunderstood.
Reason 3: I've been on the sideline for 10 years.
I've been helping a lot of other people. And in my industry, I've had many people say, "Ah, give me your ideas, Garrett…" Then they go, and they do very, very well.
Some of these people become cash cows in the financial publishing industry…
Then I think, “Wait… why are they making money off my ideas?”
And why aren’t they publishing me?
I’m told that they don’t know what to do with me.
Or that people don’t know me.
Or they’ll say, “We don’t know how to sell you as an author and economist.”
Well, it’s time to raise my hand and state my case.
Directly to the world.
I’m not waiting on this anymore.
My solution is to give it away.
Then, as people see it, they will think, "I don't want to do all that work. Why don't I just read and subscribe to Garrett's writing, watch his videos, or check out Postcards?"
Because this is the type of insight that readers will never unsee starting this evening.
As they see the opportunity, I’ll lay out…
It will change their perception of markets, media, and political leadership.
Now, this is very macro, but it is also very purpose-driven.
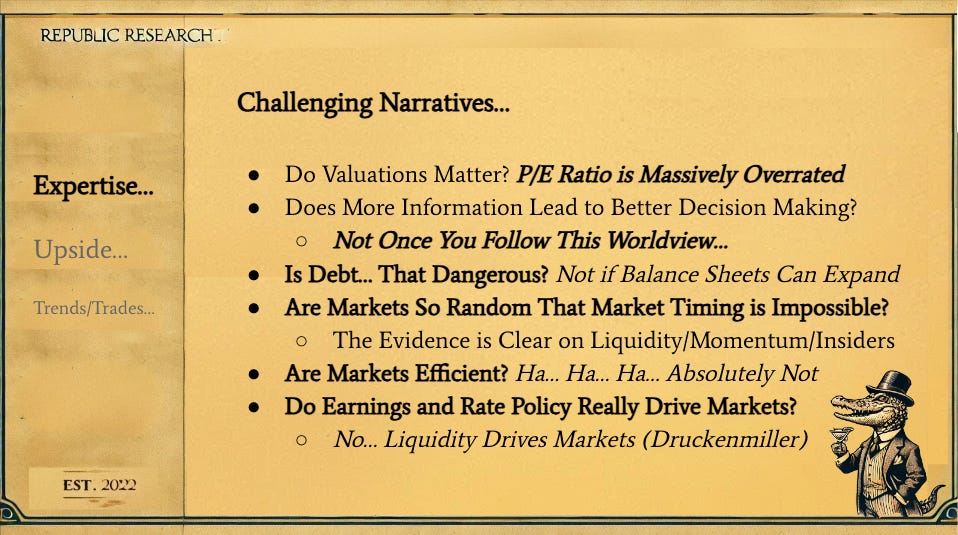
At the same time, we love to challenge narratives.
While studying at Hopkins, my first finance professor was Elie Caneti.
And the first thing that he made us learn was Efficient Market Theory (EMT).
Reading Burton Malkiel's “A Random Walk Down Wall Street.”
Elie also made us learn CAPM.
And do some long-form division.
All the students took the test, but we didn't do well.
Then Elie turned around and told us that EMT didn't work anyway.
The markets are driven by fear and greed and behavior. Let’s stop talking about this.
He tore up our tests.
We soon read texts from behavioral economists like Richard Thaler and Phillip Tetlock.
We learned the limits of the CFA and MBA approaches… and how to think differently about the markets and global economy.
It isn’t just about computer models and discounted cash flow.
It's not about what the Fed is doing at any moment.
Well, that was so critical to me.
I thought to myself, WAIT A MINUTE!
What else don't I understand, or what else are people being told that might be wrong?
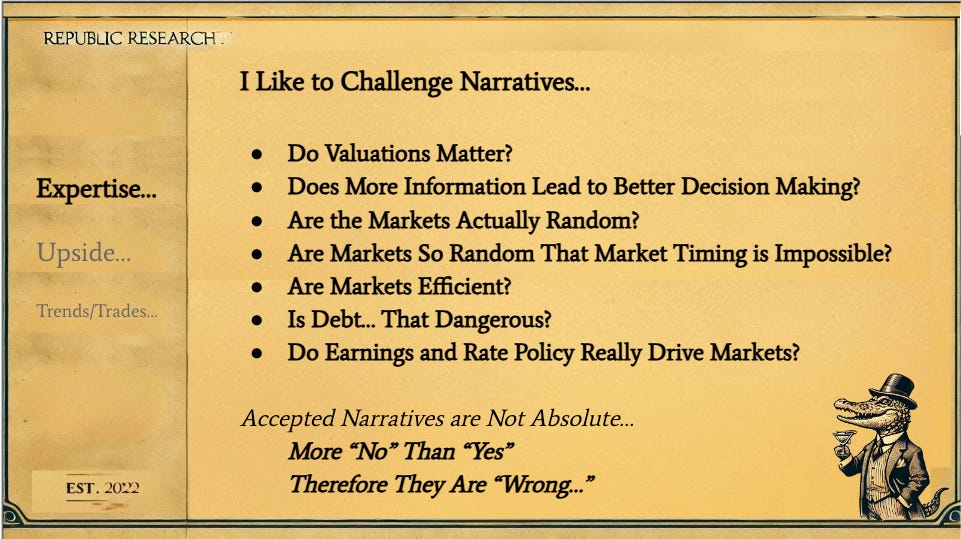
So these are the things that I thought about for 16 years:
-
Do valuations always matter?
-
Is the PE ratio that important?
-
Does more information lead to better decision-making?
-
Are the markets actually random?
-
Are they so random that market timing is impossible?
-
Are markets efficient? Is debt that dangerous?
-
Do earnings and rate policies really drive markets?
And the accepted narratives linked to these questions are not absolute.
The answers are more no than yes.
And therefore, they are, by definition, wrong.
As I said, I was upset about my friend losing a big idea and not getting credit.
So we're going to do this.
We're going to cite everybody.
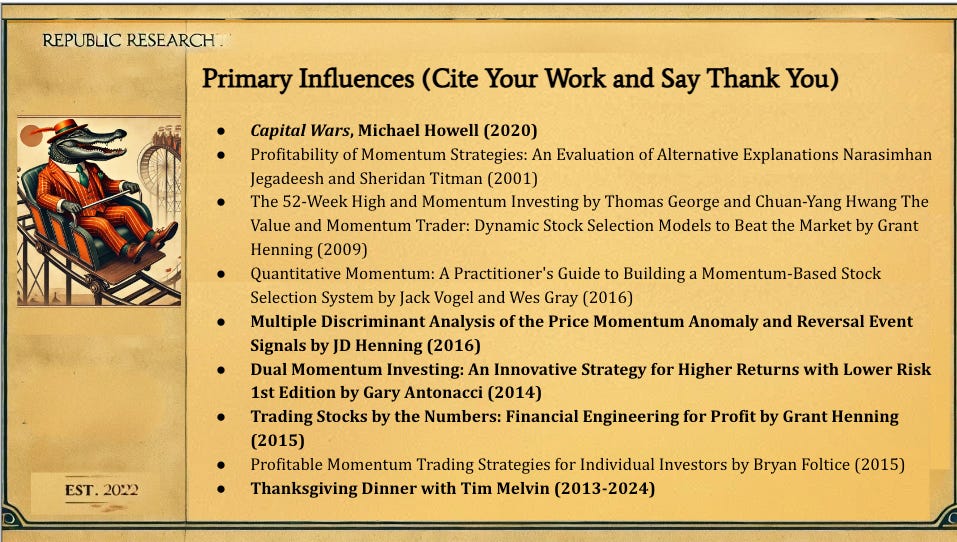
Everyone I have read and influenced me in the last 16 years is credited.
This is the reading list.
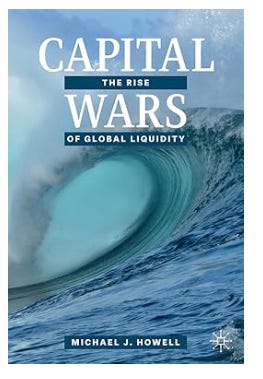
We will start at the top: Michael Howell and Capital Wars.
This book is on my desk.
I read his blog very often at SubStack, and it is worth every dollar at 75 bucks a month.
The next highlighted thing is “Multiple Discriminant Analysis of the Price Momentum Anomaly and Reversal Event Signals” by JD Henning, Ph.D. dissertation at Northcentral University.
JD is one of the most influential academics in finance, and he has done an absolutely incredible job shaping how people should perceive market timing.
He was finishing his PhD in 2016 at Northcentral.
I got my hands on Henning’s thesis a few years ago and started studying his work in 2017. He sells his thesis on his website for 20 bucks.
And if you have the time to read 300 pages, it's worthwhile.
What he has figured out is incredible.
We will lay some of it out in this presentation just a bit.
But I won’t dig in too deep because it is his work. Look it up. It’s worth it.
His father, Grant Henning, wrote "Trading Stocks by the Numbers, Financial Engineering for Profit," a great layout of technical trading. He discusses four primary technical indicators that people MUST use.
There are something like 25 different factors that you can trade on, including fundamentals, technicals, big macro ideas, and economic indicators. The four indicators he centers on have strong synergy to make momentum trading work.
If you’ve followed my work, you know what they are, and I’ll discuss them later in our conversation.
Next, a great book that Tim Melvin gave me in 2014, "Dual Momentum Investing: An Innovative Strategy for Higher Returns with Lower Risk" ” by Gary Antonacci.
It is one of the best momentum workbooks in the world.
And finally, I would be remiss if I did not give Tim Melvin a lot of credit upfront.
He is my father-in-law.
I‘ve known him since 2011. We do Thanksgiving dinner yearly (though the first one is very hazy).
The conversations we’ve had about the markets are legendary.
A friend of mine from college and I chatted the other day.
We hadn't spoken in about 10-15 years by voice.
He runs a family office, and we started talking for an hour.
We talked about private capital and illiquid assets for an hour. And we never got a chance to really start talking about what we've been up to, what our kids are doing, and how many things have changed.
And at the end of it, he said, “We have to do this again.”
I said, “Absolutely.”
He replied, “I don't get to talk to anybody about all of these different private investments. People have no idea what I'm talking about.”
I must thank Tim because sometimes Tim and I feel like the only people who speak one another's language on certain topics.
Now… all of that is out up front, okay?
All of my work is cited today.
All of this is free.
I encourage you to dive into this worldview with an open mind.
But you’ll see how the system works and how it’s designed, and you’ll get the No. 1 ticker for this approach at Republic Research.
So, let’s get started…
My focus is to get you to think differently, and we will emphasize three major factors you cannot unsee.
So pick a sector and pick a card—your card today.
Of all the heavy momentum tech and communications stocks, I want you to ignore them.
Your card is the “Insurance Sector.”
I’ll show you how we pull this card directly from the bottom of the deck.
Now, up front, there are rules to this presentation.
Before we begin, I want you to keep your hands and feet inside this ride.
More important, I want you to remember the number one rule of systems.
This is Engineering 101.
A system is set up to create the results it achieves.
This is attributed to W. Edwards Deming.
Read it again:
A system is set up to create the results it achieves.
Whatever the results are, the system is designed to do that.
Every result reveals the true design.
Today, we will reveal the true design of the financial system itself.
It Starts And Ends With a Different Definition of “Money.”
We're going to start with the first pillar of this three-legged stool.
We're going to give a toast to Global Liquidity.
Michael Howell at CrossBorder Capital measured and defined this term.
Capital Wars, Howell’s book, was the narrative shift I had sought for years.
I’d skimmed the book a few years ago but didn’t really dive in until this year.
Still, when I first eyed it during the GILT Crisis in 2022, it answered a key market question over the last 20 months.
I recall thinking that the Fed’s tapering and high interest rates would fuel a big market drawdown starting in 2023. But my view changed quickly after reading this book in late 2022… and realizing something significant was underway.
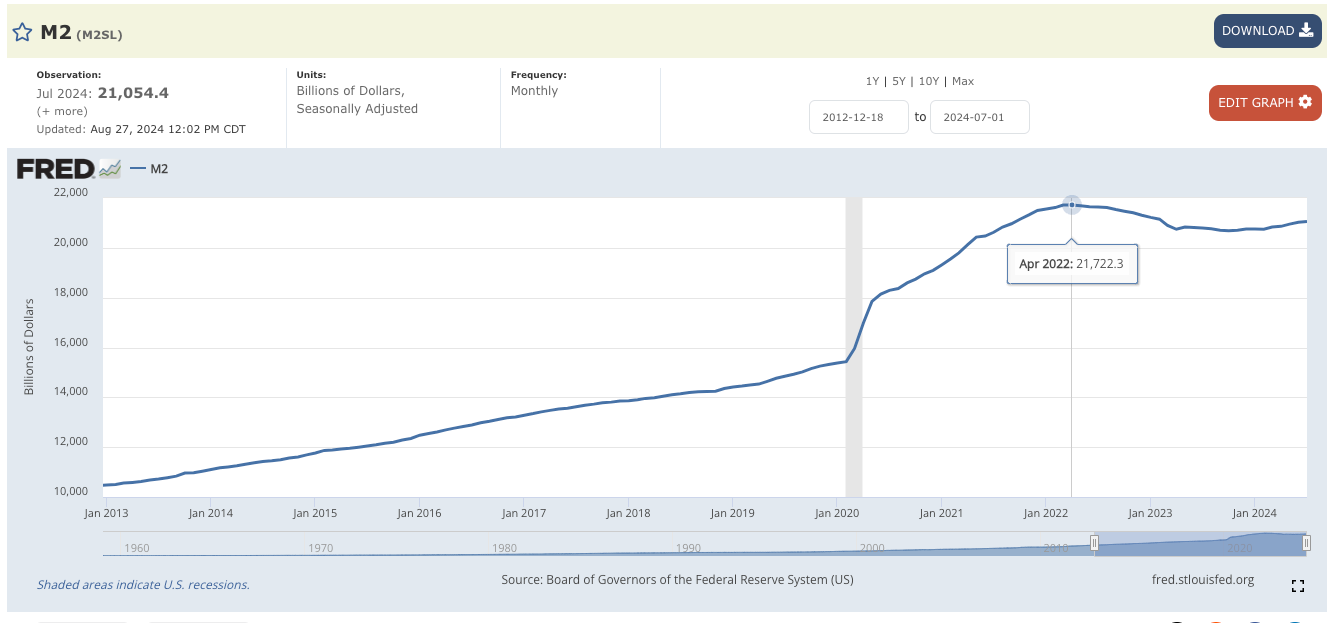
Many analysts are still trying to understand how it was possible for the S&P 500 to rally the way it did from 2023 to 2024, with interest rates elevated and the Federal Reserve lowering its balance sheet from $9 trillion to the mid-$7 trillion range.
Somehow, the equity markets shot back into the stratosphere to new highs… even though the traditional measure of the “money supply” was declining.
Even though people believed that monetary policy was the tightest it had been in decades.
We have to start by defining how Howell measures global liquidity.
It’s defined as “every dollar, all cash and credit in the financial system, influencing asset prices and global economic activity.”
Shadow banks, hedge funds, venture capital, BDCs, and other alternative facilities create a lot of capital and credit. People don’t know much about this.
The reading also includes regional bank balance sheets.
It includes corporate balance sheets.
It includes household balance sheets.
Hell, count the coins under the cushions.
And once again, Howell measures this every week.
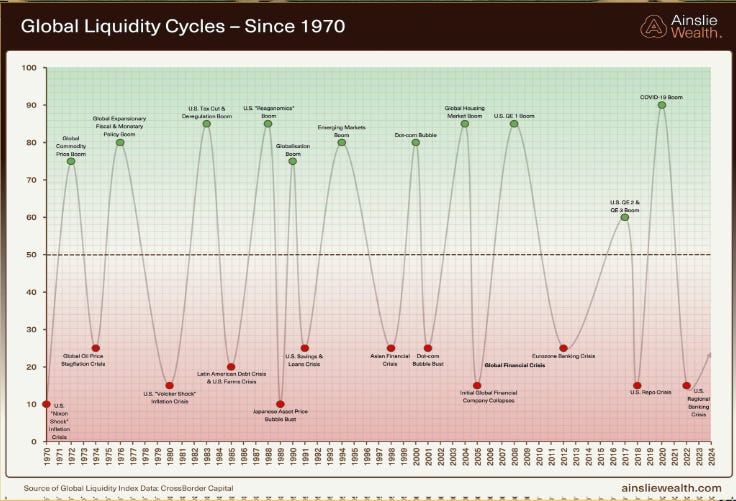
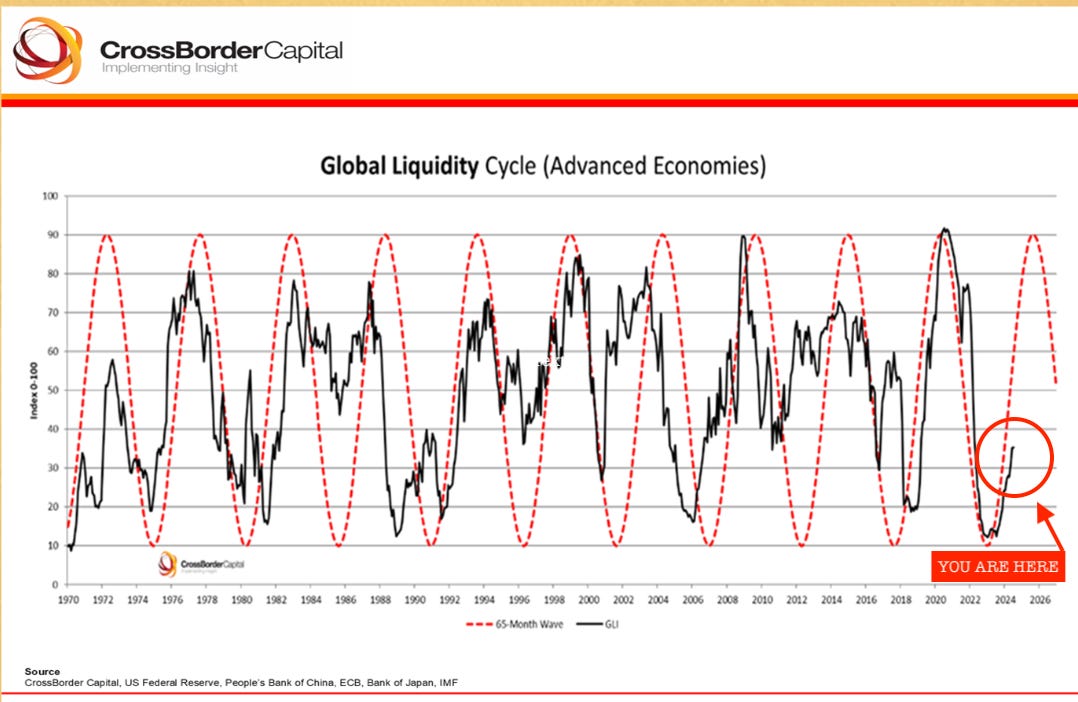
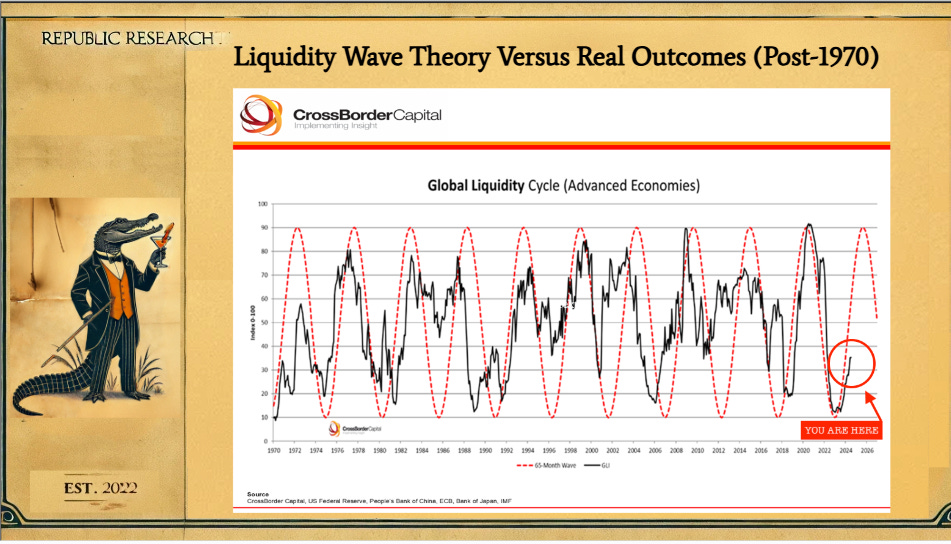
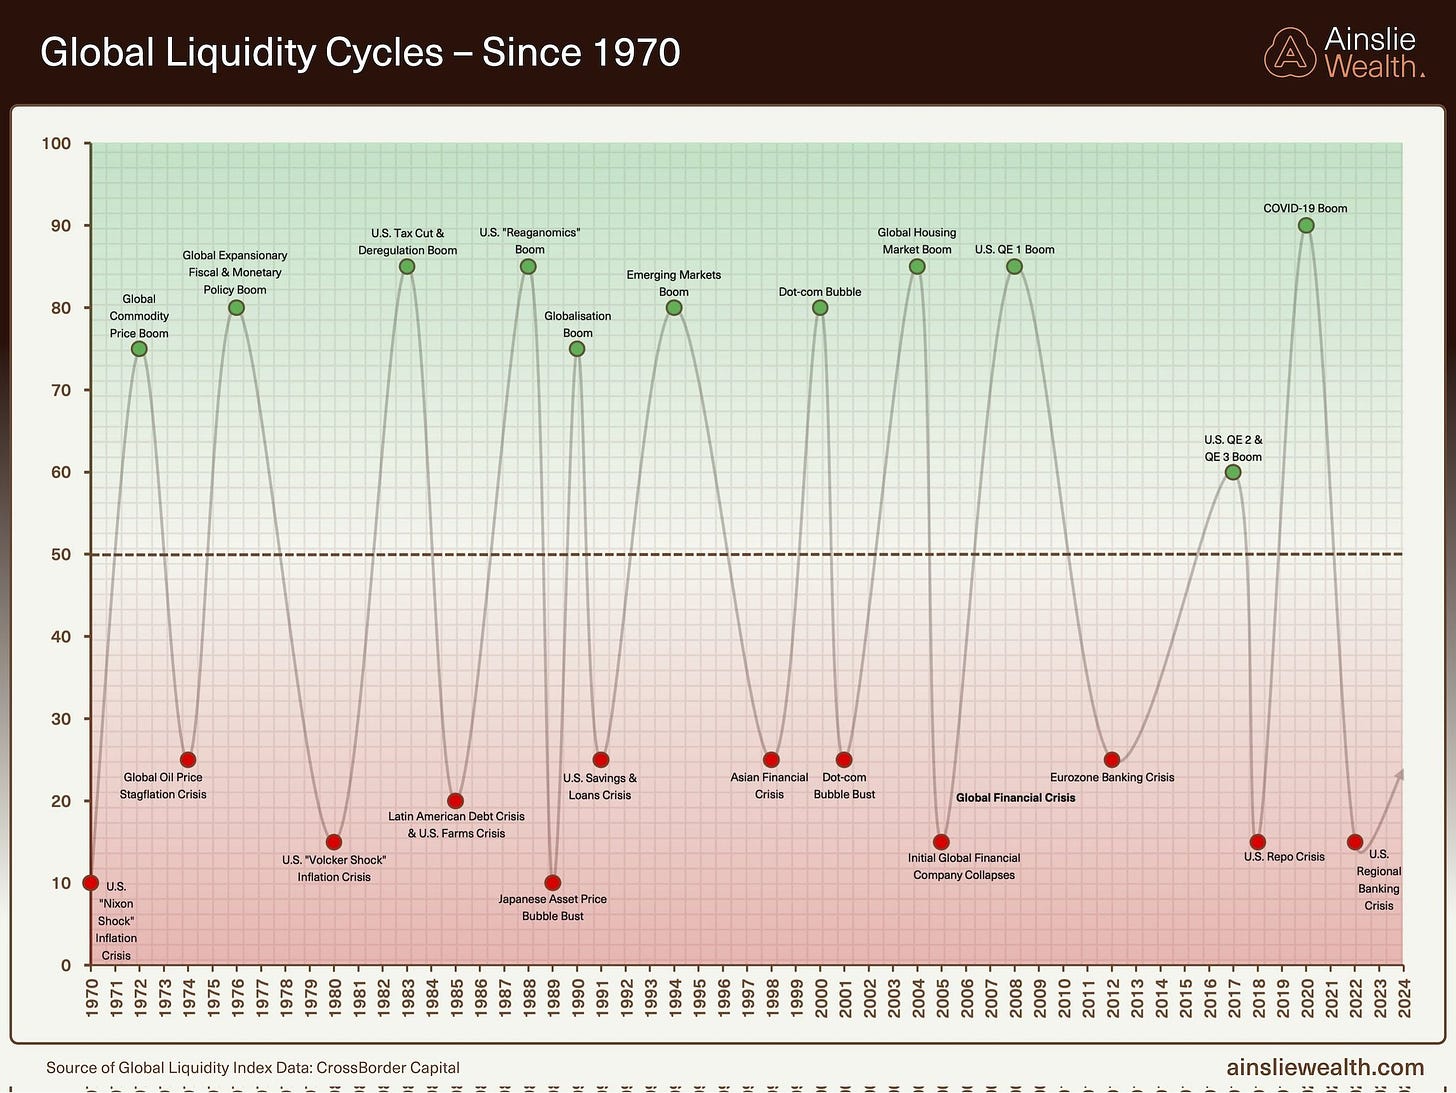
Let’s move to the next chart… Based on that measure, you get these liquidity cycles that are central to the movement of all that capital and credit sloshing around.
These are the global liquidity cycles of boom and bust in the dollar system and the global financial system (a Fiat system) post-1971.
This chart is from Ainslee Wealth in Australia.
As you can see, they are looking at the global liquidity index data from CrossBorder Capital.
Now, let's focus on this chart starting around 2008.
That’s where I started studying this world of finance, economics, monetary policy, capital flows, and fiscal policy.
I think the whole capitalistic system evaporated in 2008.
Yes… I think capitalism died in 2008.
I think we have been on life support ever since.
We continue to see a significant boom and bust number of cycles in liquidity.
But let’s be specific because what I started tracking begins at the Great Financial Crisis in 2008 (and you’ll see the other parts of the stool soon).
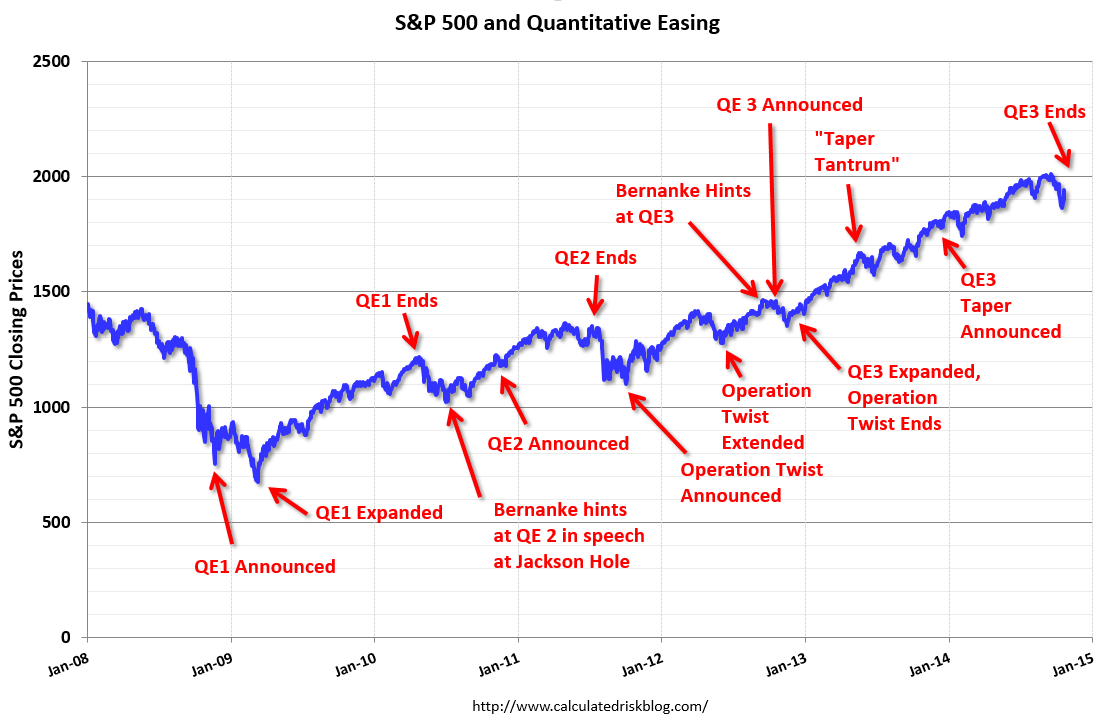
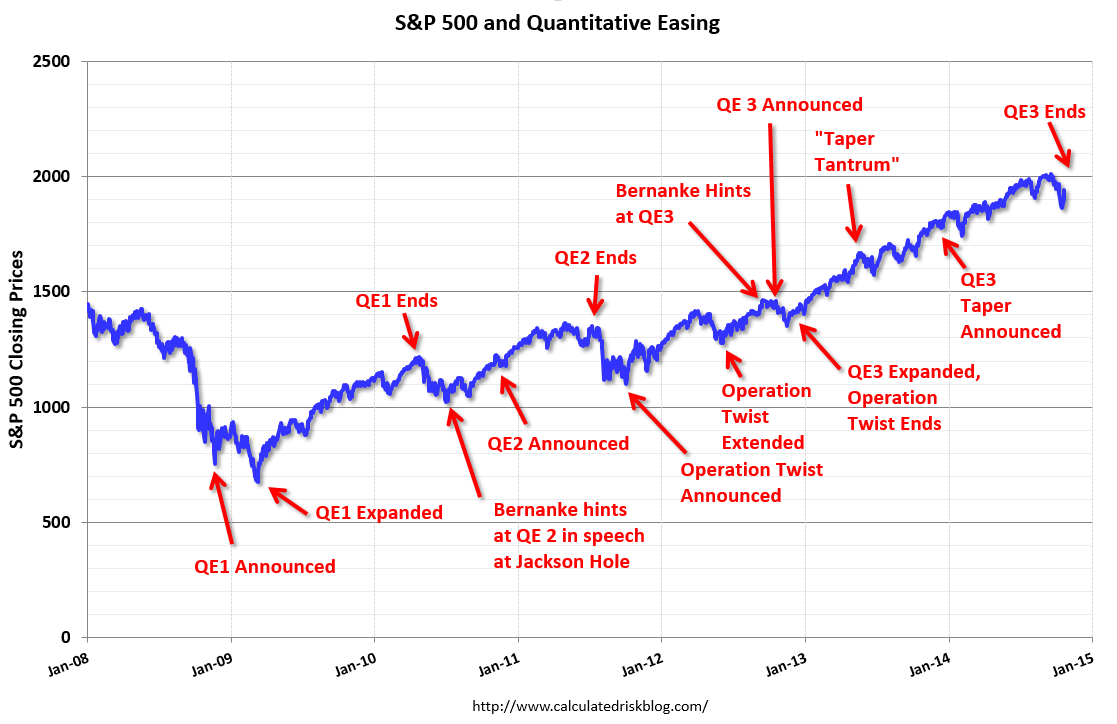
You saw the Q1 boom from March 2009, which came from Quantitative Easing Round 1 (QE1) and lifted the financial markets off that low.
As we follow the CrossBorder Capital Liquidity cycles, we next sink into a Eurozone crisis.
Now, here’s your first assignment today; remember this date…
Write this down, August 2011.
We had the Eurozone debt crisis… and a government debt ceiling crisis in America.
We also saw shifts in policies from governments and central banks that helped support the markets.
We saw additional QE from the Fed run into mid-2011 (then ended and caused a panic), plus additional support from the European Central Bank.
Then, Operation Twist was announced.
After that, the 2011 market bottomed, and they rallied into 2015-2016. (More on the role of QE3 globally in a bit)
In this window, in January 2012, we saw Ben Bernanke finally admit that the Fed had been engaging in Inflation Targeting for nearly 20 years… without an official admission of the policy all that time.
This set the 2% target officially.
By late 2015, we had another short-term crisis that involved China.
We’ll get to that in a moment, but write down January 2016. That date is important.
Markets then moved higher into 2017.
Then in 2018, we had a market freak-out called Volmageddon on February 5, 2018.
That day, the VIX surged 100%.
The event foreshadowed the Repo Crisis in the final quarter of 2018.
Write these dates down. October 2018 and December 2018.
These two months are very important later in this conversation.
During a speech on January 4, 2019, Fed Chair Powell emphasized that the Fed would be patient with future rate hikes and sensitive to economic and market conditions.
In fact, they went in a different direction, cutting rates in July 2019.
Plus, the Fed indicated it would end its balance sheet reduction (quantitative tightening) sooner than previously planned.
This was a pivot to softer monetary policy.
That led us into COVID, another crisis that required significant QE support.
The post-repo liquidity boom carried into late 2021, where the markets peaked and inflation began to roar (which we’ll explain why in a moment).
The Fed had to begin tightening its balance sheet in early 2022.
Rates needed to rise. It was the fastest rate hikes in the modern monetary era.
And that helped contribute to a downward move in global liquidity. We bottomed out again with the GILT Crisis in September 2022.
Write that important month down.
And now… we’re back at new equity highs… with a few hiccups along the way.
Why Howell Matters
Fed rate policy and earnings are overrated when you really think about the liquidity theory and the arguments that are made by Howell.
Liquidity theory offers a rational explanation for market spikes and crashes since the GFC.
What Howell lays out is that the bulk of new capital/credit is not created by the central bank systems or the traditional banking sector.
The shadow banks are responsible for roughly $106 trillion in liquidity today.
That is a big number, right?
Well, you're going to see how big it truly is in a moment, but this goes back to a lot of the research I reading by former NY Fed analyst Zoltan Pozsar and his team on the role of shadow banks in the GFC.
(You’ll need to read Pozsar too. He just left UBS to start an advisory firm called Ex Uno Plures. His writing is legendary, and people trade his insights on the dollar system "like music fans swapping bootlegs," according to the Wall Street Journal.)
Now, Howell’s measurement puts the shadow banks well ahead in the financial game.
In fact, but most people don’t understand the role of both the shadow banks and the central banks and who does what in the system.
The central banking system's design is to provide support to global liquidity and prevent deflationary crisis globally.
I don't think that Howell has written that explicitly, but that is what I have inferred from his work over the last few years, and that’s what this system seems designed to do - because that has been the outcome since the Fed started inflation targeting in 1993.
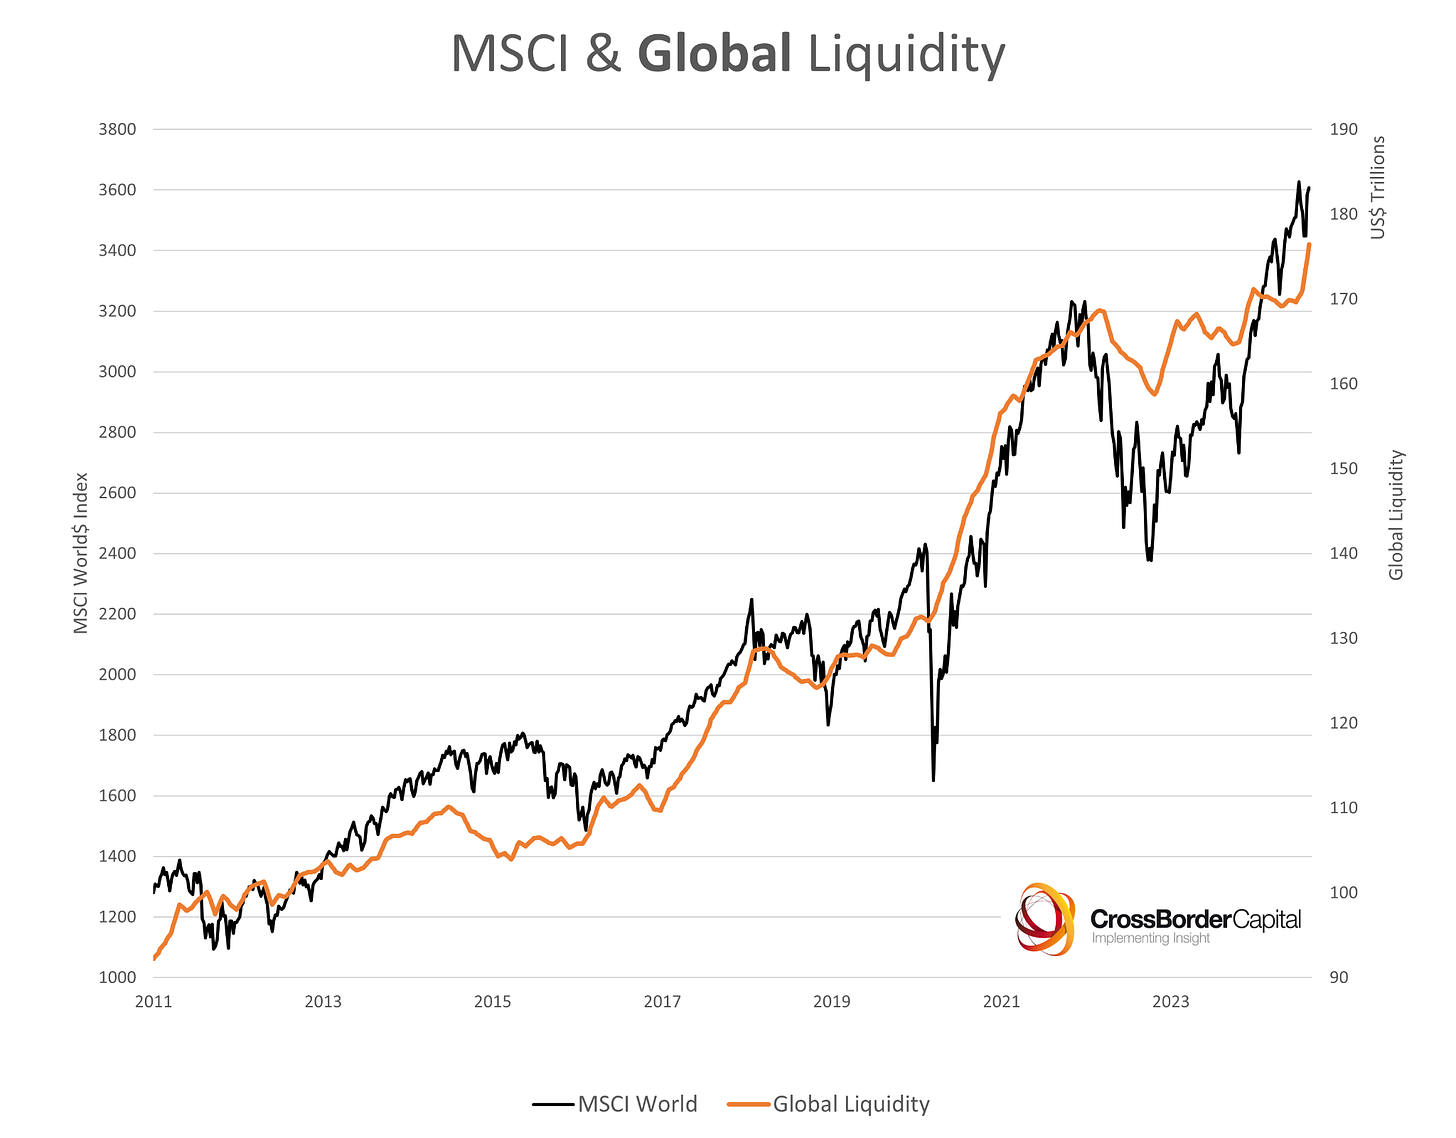
This is a chart from Capital Wars.
It’s the MSCI Global Index performance laid against Howell’s Global Liquidity figures.
It provides a very good thesis as to why QT efforts did not lead to a 2024 crash, and it has defied the bearish crash calls in this financial publishing industry.
So for all the people who say, “I think the market's going to fall 50, 60, 70 percent in 2024,” they never followed liquidity cycles in any capacity.
Howell updates this every week or so.
Look at it.
Howell shows that in 2011, we were $100 trillion in global liquidity.
We are at $177 trillion today, including an increase of $9.5 trillion since January 2023, with the lion’s share coming from the shadow banking system.
As you can see, if you look at the MSCI World Index, global equity, and then look at global liquidity, as he has described it, you see a monstrous move up in the world index, going back to 2011 from roughly 1,300 to where it is at 3,600 today.
That is a significant move and a direct causal relationship between these two lines.
Now, if we look at 2018, which we're going to discuss in a moment, late 2018 was a bottom in the cycle.
The repo crisis transpired September through December, and in December of 2018, the S&P 500 cratered in the final month of the year.
And then the Fed pivoted. Certainly after the Fed pivoted and provided cuts and later engaged in QE during COVID-19.
Well, the market went a lot higher.
In fact, we saw a cycle from late 2018 up to the COVID top, a move in global liquidity from about $125 trillion to $170 trillion in three years.
The market loved all of that liquidity.
But, there was a major crisis that transpired in 2020.
Let me show you how simple this was to anyone paying attention.
Two years ago, a comedian on Netflix laid out exactly what I'm stating in one of the best five minutes of comedy that I have ever seen. (Language warning)
I am a huge George Carlin fan, and this is up there with Carlin's best of understanding how BIG systems work.
Mo Amer points out is that when COVID started, everybody couldn't go to work.
And he says, “Well, I have to go to work. I have to pay my bills? I have to pay my bills. Tell the government send me money!”
The government replies, “No. We are 20 trillion in debt. We don't have any!”
And he points out, “Well, the stock market starts crashing (March 2020).”
Oh no… not the stock market!
We can’t have the market crash because America!
Quick, the government screams, “Pump $3 trillion into the system!”
Yet, everybody is at home with all this “money” coming in.
Then suddenly the stock market starts screaming into the sky.
And what screams is akin to: “Wait a minute. I thought that this was all based on cash flow. I thought that this was all based on numbers. I thought this was based on fundamentals and how the economy was doing. How is the line going higher!!!”
This resembles what I was told before all this QE started… to follow security analysis.
As we know, in 2020, the government and Fed injected trillions and trillions of dollars.
They created 30 to 40 percent of every dollar ever in existence.
And as we have heard from Howell, “Money moves markets.”
Stanley Druckenmiller has also said that liquidity moves markets.
Five minutes of standup comedy point that out beautifully.
Getting Into Liquidity Cycles
These are the Liquidy waves and cycles that Howell lined up.
This is a very similar chart as the one shared by Ainslee Capital.
Howell argues that the bottom of the liquidity cycle most recently transpired in October 2022.
That was where we saw a massive equity downturn start in the wake of Jerome Powell's speech in August 2022.
And we'll get to how we knew something was wrong at that point.
But we didn't know during that period what it was (more on how we avoided it and found out soon).
There was a GILT Crisis in England, the Bank of England effectively had to engage in a soft default.
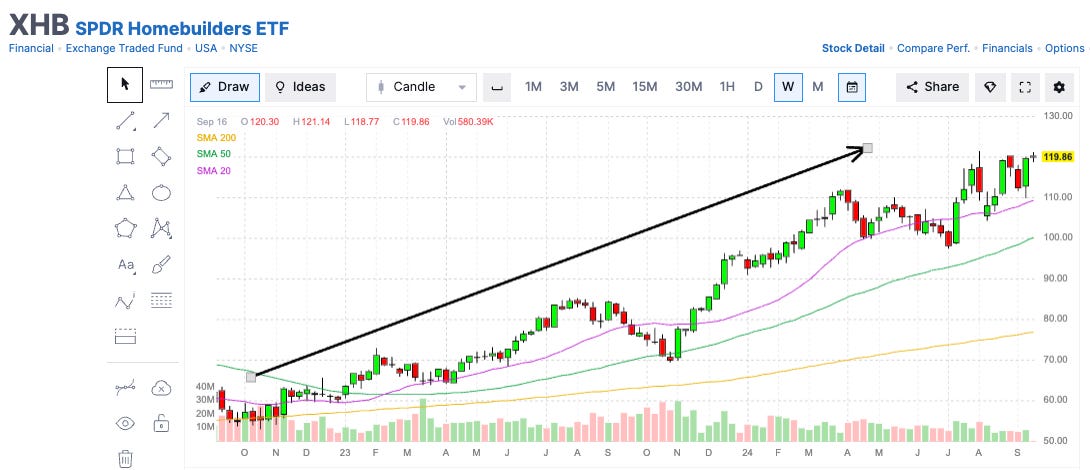
The United States Federal Reserve changed its policy on mortgage-backed securities (MBS). Not a lot of people seem to realize this, but look at the chart.
From October 2022 over a year, homebuilder stocks recovered more than 80%.
Thanks, Fed.
Thanks, Jerome.
Finviz
That rally came largely on the back of that global pivot that transpired.
In fact, I recall that in December 2022, when people were panicking about the Tax Harvesting Sell Off, Howell had called that bottom.
He repeatedly said that anyone looking for a new bottom in the market had missed it because the Liquidity Bottom was at the beginning of October 2022.
I had started 2023 with an aggressive call to the downside for the market, but quickly changed my tune when I realized that the Peoples Bank of China was very eager to pump money into an economy that hadn’t even reopened yet.
Basically… exactly what happened in the U.S. just two years ago.
We started our long-term bullish take on things at around 4,000 based on this realization.
Now, we’re still sitting on a 6,000 call from earlier this year.
I’m starting to think I’m going to need to raise it soon if there is broader coordination from the U.S., China, and Japan on policy around the dollar in the months ahead - and if China does proceed to pump the $1.4 trillion into its system that the Financial Times has suggested.
Howell notes, we’re not at the top of this current cycle.
And if you look at these notes (from his book), you realize how absurd this system is.
And how it delivers the results that it’s designed to deliver.
What makes this current cycle unique?
Let’s cite some recent statements by Howell.
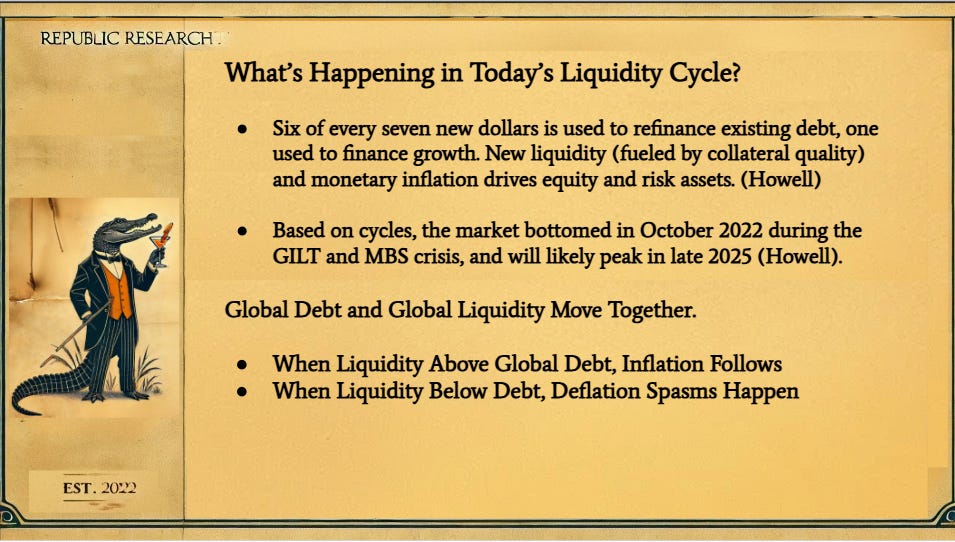
Start here: Six out of every seven new dollars is used to refinance existing debt, and only one is used to finance new growth. Howell noted in August that there is “US$350 trillion of private and public debt outstanding, with an average maturity of around 5-years, this means that a whopping US$70 trillion has to be refinanced each year.”
We’re rolling over debt constantly… which requires more liquidity, and an expansion of balance sheets on the private sector side.
More liquidity finds its way into fueling risk assets.
And…
“Money moves markets,” Howell says, using this quote in projecting that the market bottom was in October 2022. He expects it to peak in late 2025.
I'm anticipating around Q1-Q2 of 2026 because there still is a lot of fiscal stimulus coming into the market next year, both from infrastructure and from the CHIPS Act.
He also explains that global debt and global liquidity move together.
And when they’re out of whack, we get different monetary results.
When liquidity is above global debt, you receive inflation.
There's more capital, there's more money chasing fewer goods.
But when liquidity is below debt levels, and there's not enough capital to pay off debt or re-finance that debt… That's where these liquidity events transpire.
We're going to point out how we were just in one about a week and a half ago.
We're still in a big picture problem, but something that happened this week is very reminiscent of events that have transpired in recent years.
Everyone Has a Role
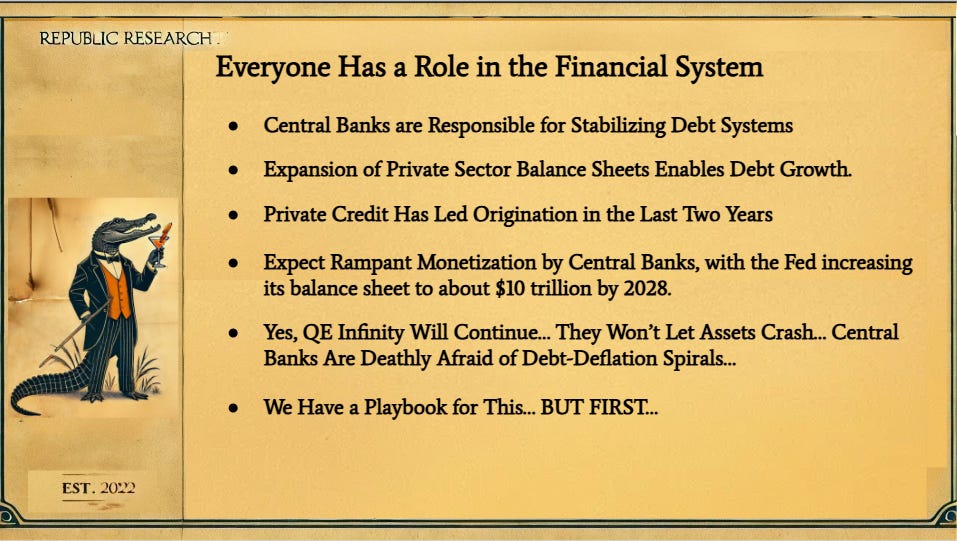
Central banks are responsible for stabilizing the world's debt systems.
The expansion of private sector balance sheets enable debt growth.
Private credit has led origination at a massive level in the last two years, helping the markets move much higher.
And as Howell lays it out, each cycle averages - trough to trough - five to six years.
From Octover 2022 that puts us somewhere around late 2027 or maybe 2028 for that bottom.
It could be fiscal repression, where they will buy the front end of the curve to try to reduce the rates and drive up the end of the yield curve.
Or it could just be that we will buy many mortgage-backed securities;
Who knows?
There are many different things that they can do that they can get creative with, just like they did with the discount window for regional banks in March 2023.
In fact, the Fed just eliminated the relevance of stress testing because now banks are measured on access to the discount window and preparation for liquidity events.
Talk about moral hazard and a massive admission of how the system works.
We're expecting rampant monetization levels by central banks at the next bottom of the cycle. That's where the Fed's balance sheet, which had originally started at $200 billion in 2002, jumped to how trillions come 2011, then as much as $9 trillion recently.
We'll likely go above $10 trillion, possibly $12 trillion.
They can’t fix this.
They can’t unwind all that debt…
So, yes, QE infinity is going to continue.
They are not going to let assets crash.
Central banks are deathly afraid of debt deflation spirals.
We have a playbook for all of this, but first, let's get to the second leg of the stool.
Market Momentum.
I just cited Howell as my primary influence for understanding the liquidity side.
I've cited Elie Caneti on the central banking side and study of behavioral finance.
And now we get to this chart.
J.D. Henning - he's phenomenal.
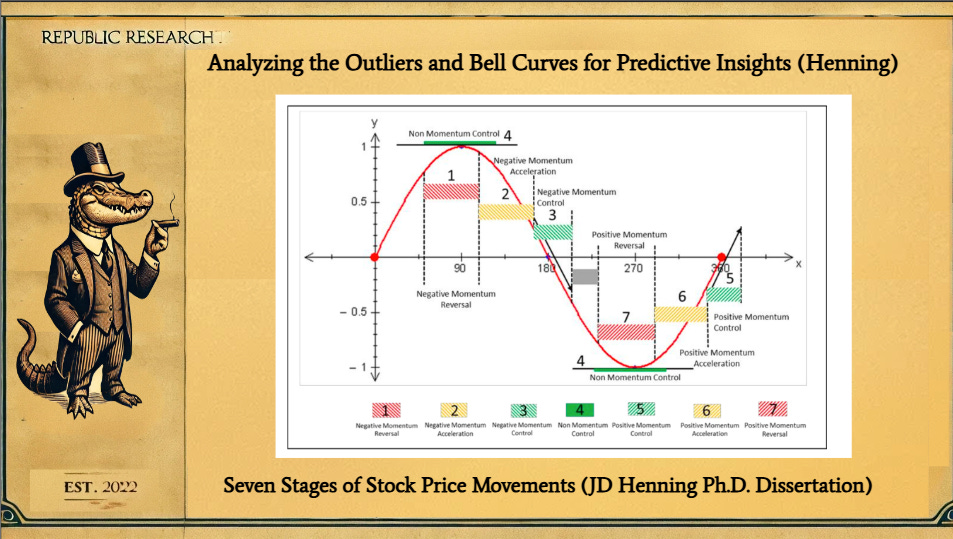
He wrote his Ph.D. dissertation in 2016. We point to this chart.
This chart is what you need to understand in order to avoid a significant crisis in the financial markets.
JD lays out that stocks move in seven different directions.
They’re labeled the Seven Stages of Stock Price Movements.
Within those seven different directions, you want to look at the outliers.
So the first stage is a Negative Momentum Reversal.
That's where an individual stock is moving much higher, it’s going to its peak.
You might see this happening when analyzing the Relative Strength Index or maybe the Money Flow Index. But in the wave of stock movement, they're near their top.
Well, now they're going to start to REALLY turn negative.
That's where the outflow really begins in the stock.
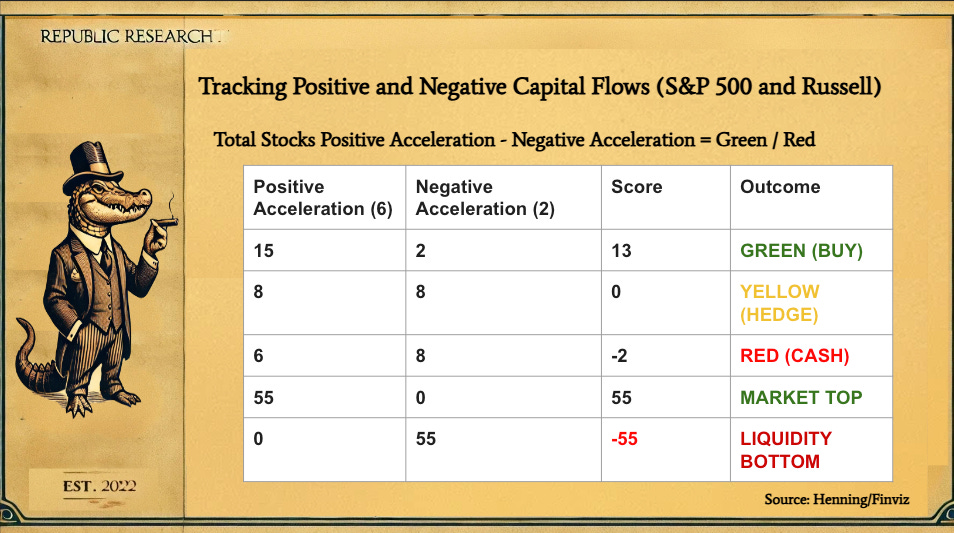
So what he's doing is he's measuring the number of stocks that are in state Number Two called “Negative Momentum Acceleration”
Then you have three stages where the the slowdown continues but cools, then things and then the stocks finds its bottom, and then we start to turn the other way and heading higher.
I’m not implying that it’s THIS simple and stocks aren’t always going in these waves, it’s just a measurement of where it sits in a specific level price action and what stage they are in depending on the calculation linked to how they are moving.
This is all outlined in his research… and this article from 2017.
Then you get to Stage Six where money flows into the stock aggresively, causing a “Positive Momentum Acceleration” - or a breakout.
And this is where a stock is breaking out 5%, 6%, 10%, who knows how many percent in less than a week, maybe 10 days.
Now to the math.
He’s not just looking at individual stocks on their own.
He’s looking at the aggregate.
He’s measuring the total number of stocks that are in Stage 2 - accelerating down versus the number of stocks that are in Stage 6 - accelerating up.
And then he's just simply doing a math equation.
Basically: How many are accelerating versus how many are decelerating in those specific outlier zones?
On a net basis (There is some logarithmic analysis that must be done, but I’m trying to keep this as simple as I can).
It all makes sense because when you have a scale at the S&P 500, and you see a company like NVIDIA dropping hundreds of billions of dollars of market cap in a day, that could just be a one-off.
That doesn’t mean that outflows are hitting the whole market - especially if there is only company specific news.
But if there are dozens of stocks going down very, very quickly, and only a few going up, money is leaving the market. If the number of stocks in Stage 2 (down acceleration) compared to Stage 6 (up acceleration), things aren’t going well.
The question is WHY is this happening.
As I’ll conclude when we add the third leg of the stool to my worldview, it’s largely based on liquidity, global collateral quality, short-term deflationary worries, and credit challenges, or big macro events like a Pandemic (which creates the same issues and a need to fix the market plumbing).
Now, what about the other direction?
In a breakout for the S&P 500, the Nasdaq, or the Russell (or any sector you want to track or index you want to follow), consider lots of stocks breaking out in positive acceleration (and few selling in negative acceleration).
Well, then money's gushing into the market.
At that point… Get on board.
Buy…
You're going to start to see ETFs bidding back up.
You're going to start to see capital rotation into the breakout names.
This is a time when technology stocks tend to do VERY well.
There’s a strong relationship between big selloffs in the S&P 500 and technology stocks… and strong breakouts for both.
They’re very intertwined.
Now, again, if things are yellow (even on the two sides), that's a hedge period.
If things are red, start to get out, move to cash, really hedge.
When you see nothing accelerating to the downside and everything is positive, it’s likely this is a market top.
It’s also a time where short squeeze are rampant, and selling just isn’t in the cards.
That’s happened a few times in the last three years.
And when everything is really negative and no one's buying anything, when there is no stock breaking out, that's when you should be buying everything.
I’ve tended to see this is a liquidity bottom… in the crisis events that we’ll discuss in a few minutes. But you’ll also see who starts buying in these extreme periods, and why.
During those periods (late 2018, March 2020, September 2022, October 2023), there is an incredible amount of money flushing out of the markets.
These periods are when we’ve seen central banks provide support to the financial system - because there’s something wrong with the financial plumbing.
Since the system is designed to perpetually offer support to prevent debt-deflation or credit crises, we tend to see buying activity from ONE group of buyers.
More on their identities in a moment.
These are short-term panics, defined as “a climate of fear caused by an economic crisis or the anticipation of such a crisis,” via Britannica.
They occur every few years and align with the bottoms outlined by Howell or when bond and other asset collateral is really in bad shape (see the 10-year bond’s move to 5% in October 2023 and the impact on equity markets at the crisis’ height).
Now, I have done a lot of analysis of Henning’s work - and intertwined it with other momentum observations and texts from authors on the subject including Antonacci, Wes Grey, Fama-French, Jegadeesh and Titman, Alfred Cowles and Herbert Jones, Rouwenhorst, and more.
I've looked at this very deeply - and Henning’s concept speaks to me because I’m so very intrigued by market anomalies, tail risk, and the outliers in performance.
You're not going to do it as perfectly as he might, but you can build a Risk On-Off system.
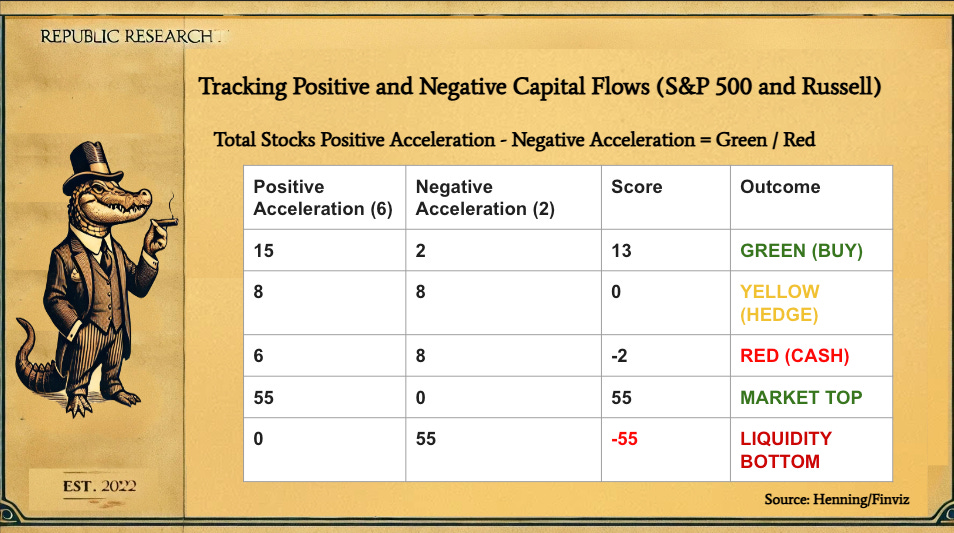
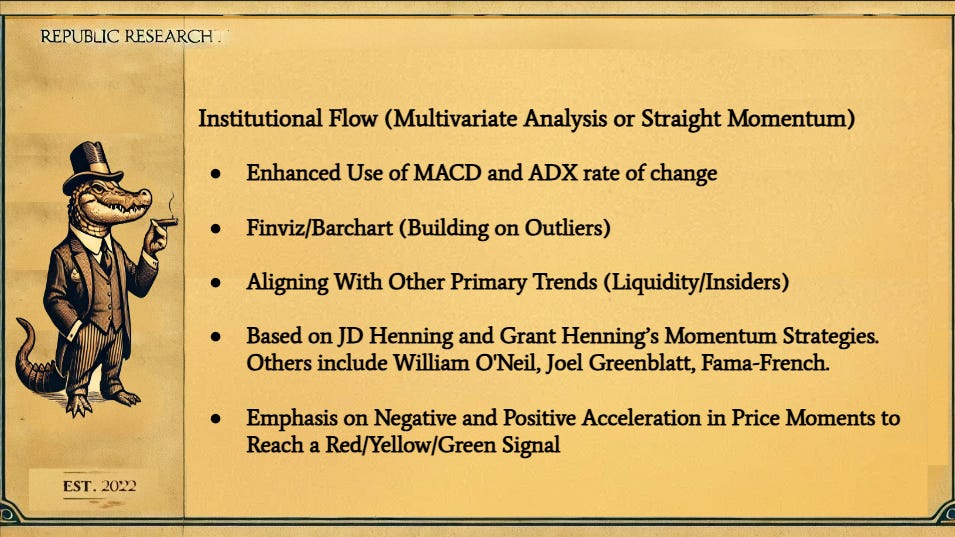
We adopted a similar strategy, but we infused it with additional technical analysis to get a sense of what is a false start on these equations by looking at the rate of change on the various indicators to understand capital coming out through the S&P 500 and the Russell 2000 at the exact same time.
Then we moved it over to the Nasdaq as well to by using price data from Finviz and BarChart.
We added additional insights from the world of William O'Neill, Joel Greenblatt, Gary Antonacci, and Fama-French.
You want to have a signal that's positive or negative, which is what we’ve done.
We look at the signal every day, and then we look at Howell’s liquidity figures, updates on the Economic Conditions Index, a variety of macro-economic factors, and bond spreads, and compare it all with our “Final Stool”, which I'll lay out in a moment.
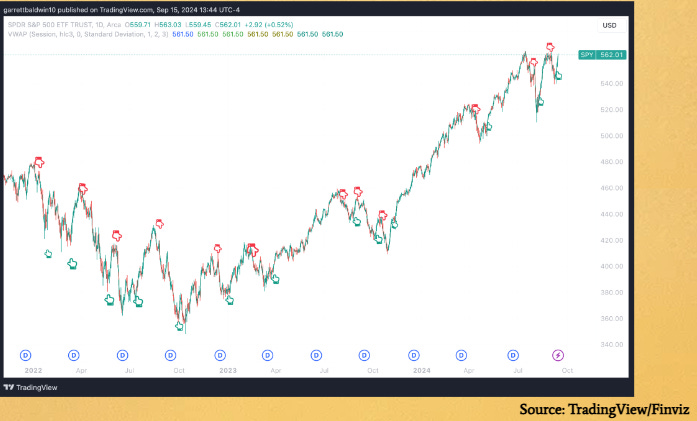
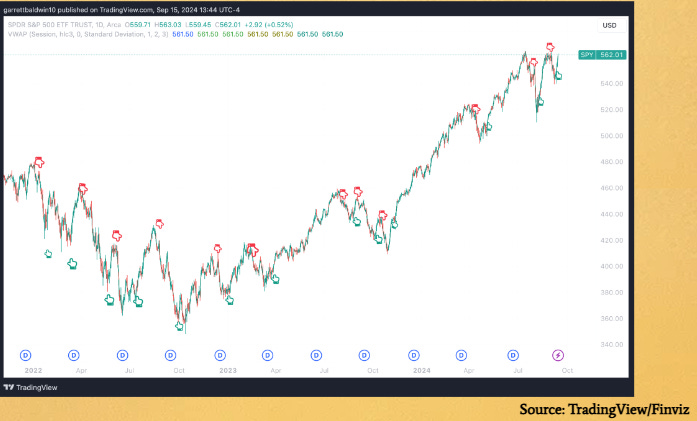
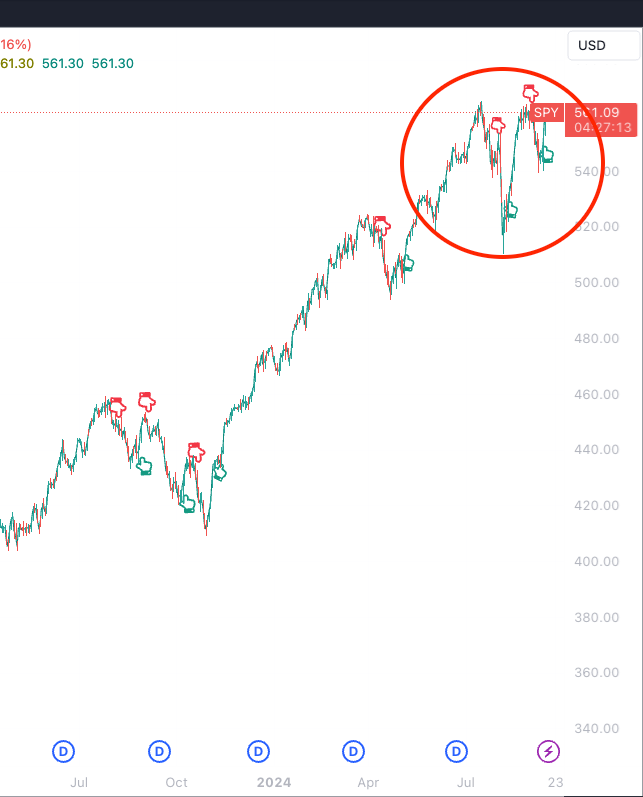
We end up with this… layered into TradingView.
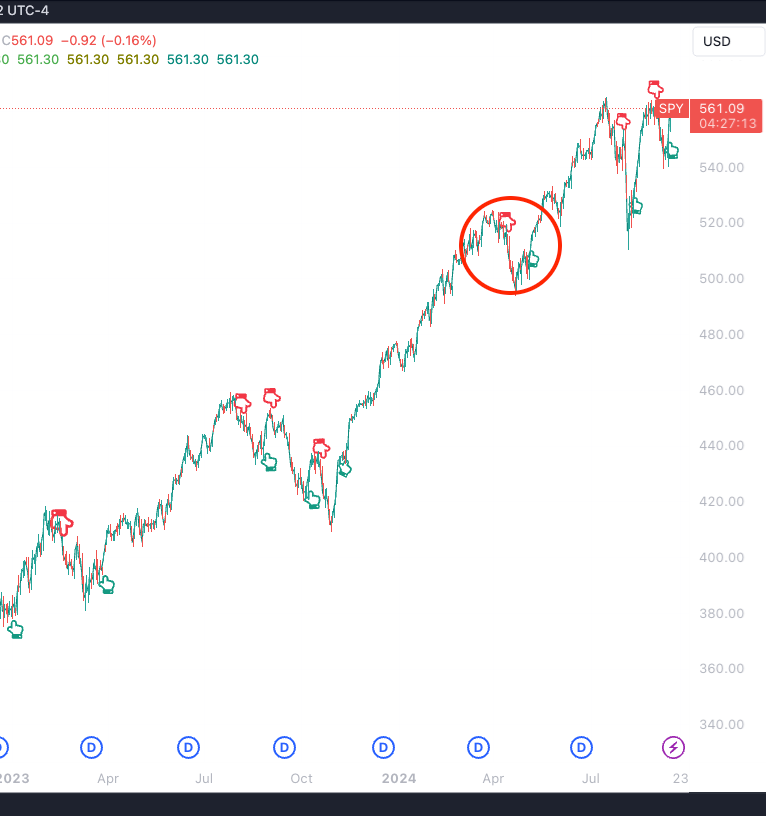
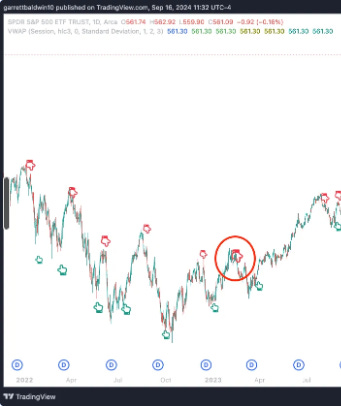
This is the positive and negative signals that have come since January 2022.
These are all the predicted selloffs and buybacks in the market on the aggregate from my editorial and appearances on camera since the start of last year.
If you can utilize RSI and MFI and MACD and ADX to kind of replicate this, or you can do the measurements of stocks, or you can just simply look at a specific measurement that exists. It’s important to look at rates of change on these readings.
Virtually every macro hedge fund or volatility desk I know has some reading of this in some capacity. But what you're going to see here is that the S&P 500 pops just a little before things really start to sell off.
It never starts right at the short-term top.
There’s usually a little bit of outflow. There's a couple of days of selling, then there's a tiny, measured pop that drags people back into the market.
And then the selling accelerates on the aggregate… quickly.
Now, you might look at this chart and you're suggest:
“Okay, he's picking tops and picking bottoms, cherry picking from the last two years.”
No, I'm not.
First, I’ve been writing about this and been on air for two-and-half years, and this stuff is on the record. Second, you’ll see the real selling never comes at the absolute top, and the real buying never accelerates at the absolute bottom.
So, hopefully, you understand Howell’s liquidity influence, Henning’s quantitative influence, and (the third stool coming) forge a market timing mechanism…
There’s a very important thing about each of these selloff: I rarely can predict why this major selloff is happening or what it is until a week or a month later.
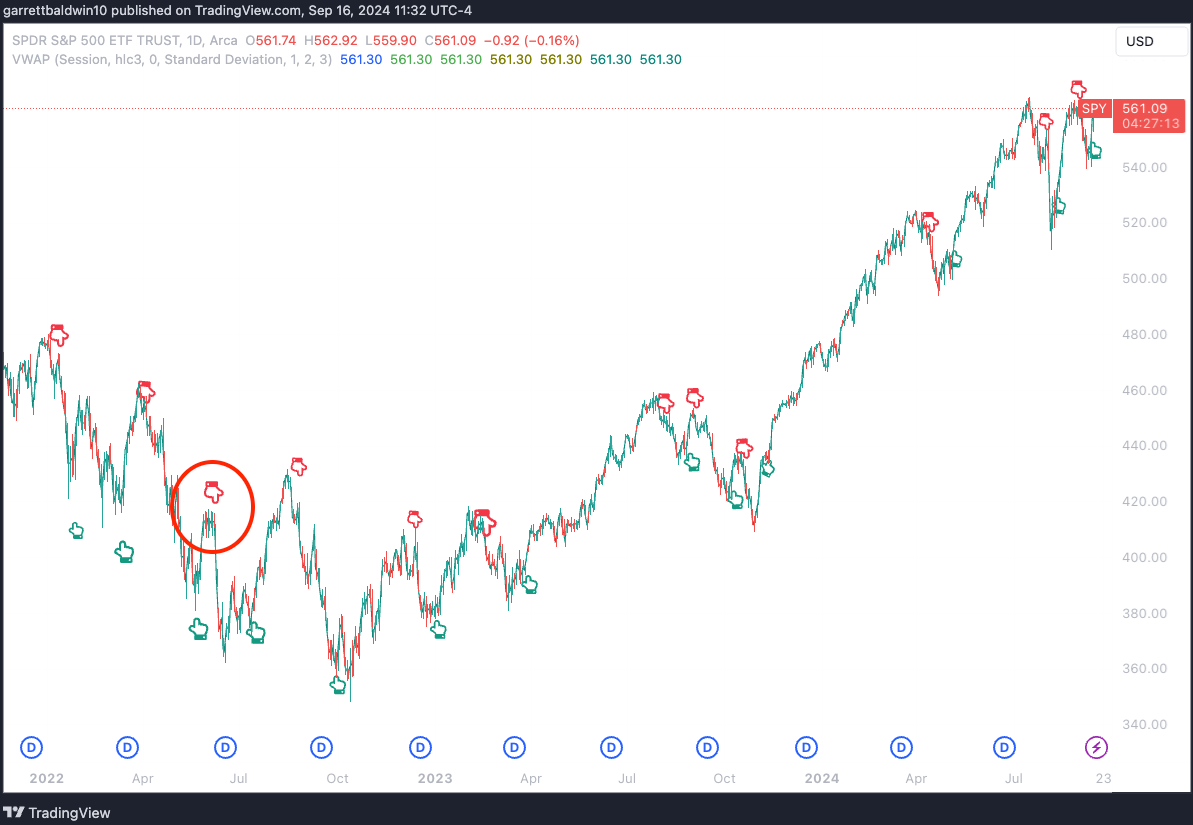
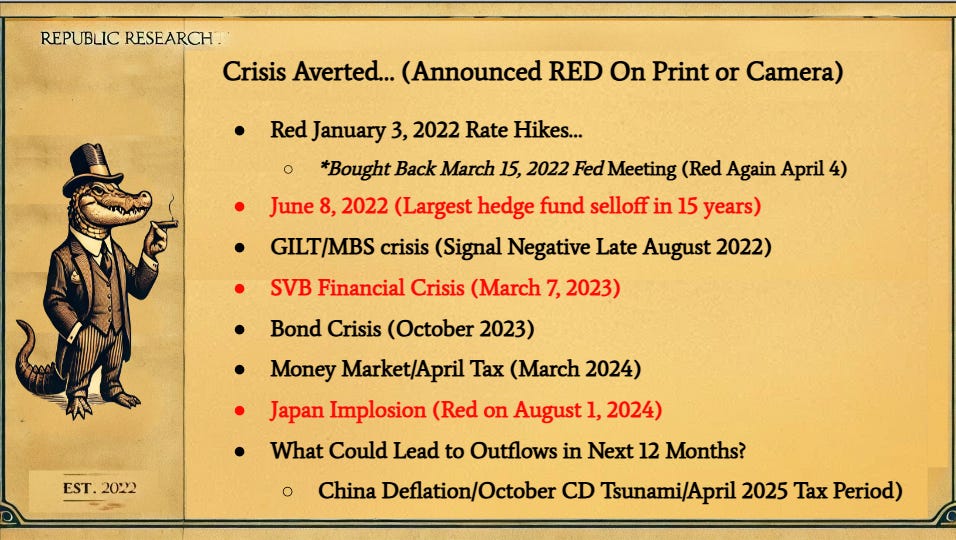
For example, on June 8, 2022, the signal turned negative.
We had a monstrous sell-off for a week after this date.
We didn't know why this selling started… We just knew something was wrong.
We learned from CFTC data a week later that this period was the largest hedge fund sell-off in 15 years.
How about this signal that Tim and I had focused on?
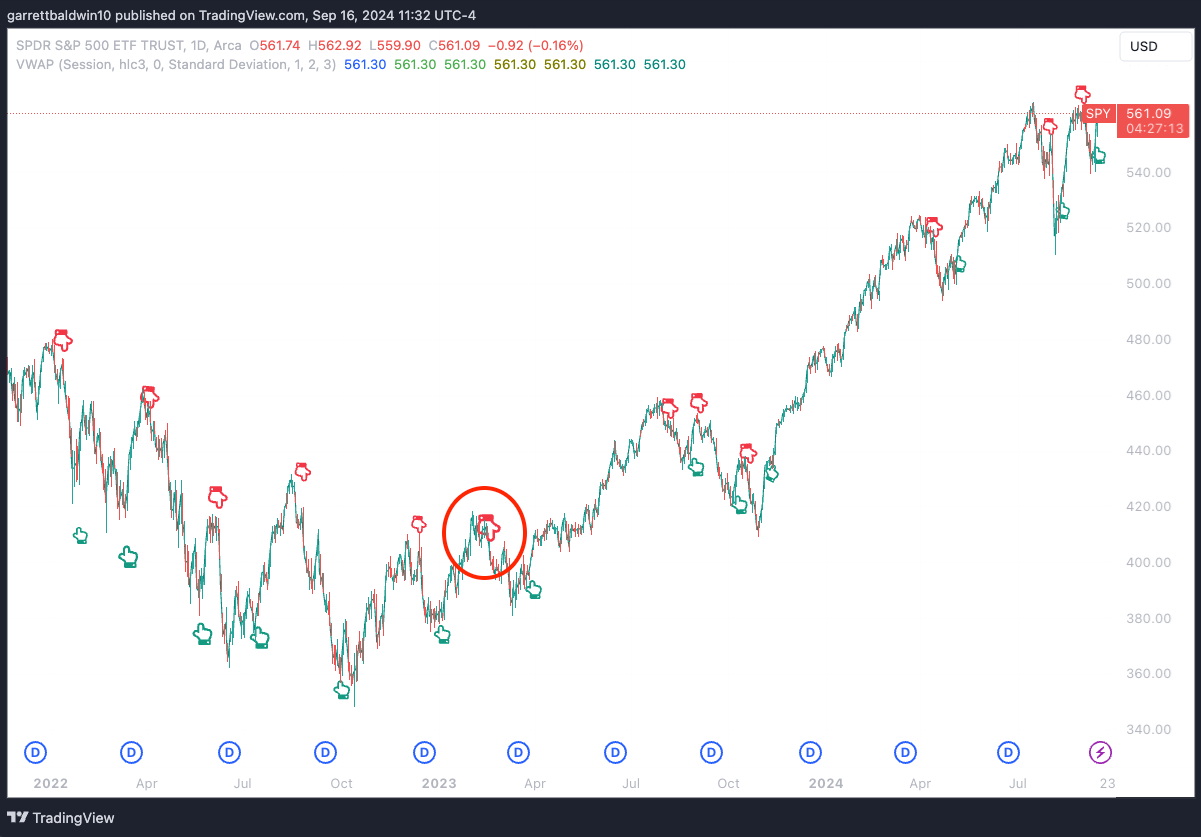
This is March 7, 2023.
We were on air talking about it… and I wrote about that negative turn that day.
We were looking at the MACD, we were looking at the ADX, we were measuring stocks, just looking at the number of stocks that are up in 10 days, 10 percent, and the number of stocks that are down 10 percent in 10 days.
It was just net plus-minus.
Again, we went negative on March 7, 2023
And no one knew what was going on.
Some CNBC analysts and people at Reuters said, “Oh, this selloff is due to the jobs report that just came out from February 2023!”
No.
A few days later was the Silicon Valley Bank (SVB) crisis.
No one knew what was happening.
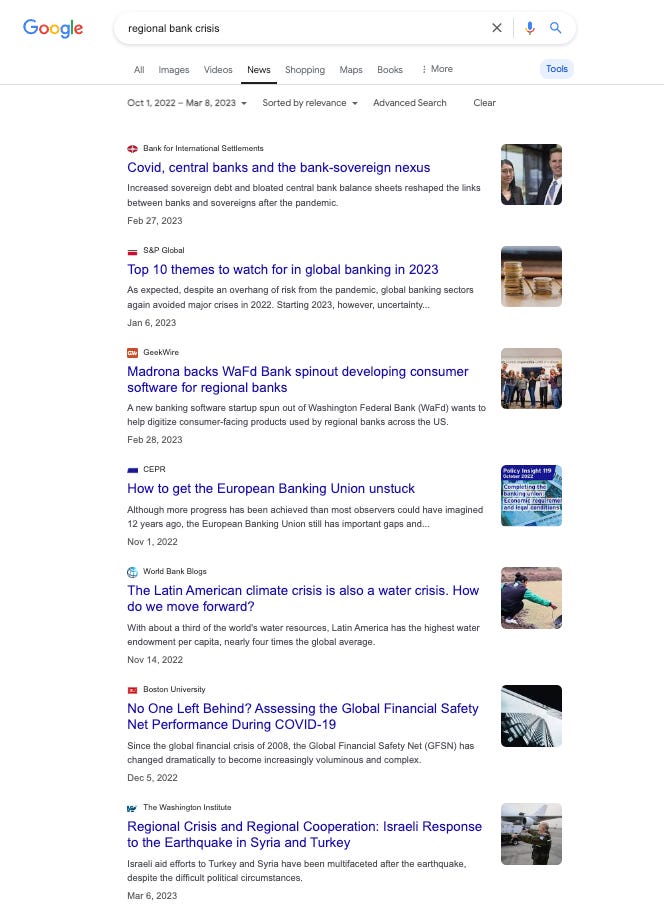
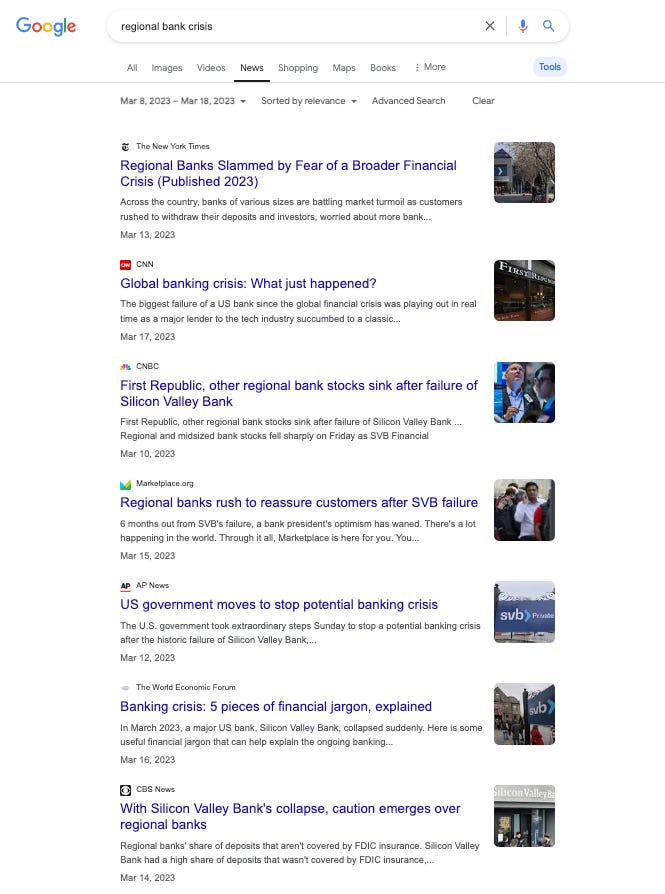
In fact, go to Google News and you set a cap on search results BEFORE March 8, 2023. Then start your search six months prior.
Type in “regional bank crisis,” “regional bank illiquidity problems,” “regional bank problems,” “regional bank,” or anything related to what happened that month.
Here’s a search from October 2022 to March 8, 2023…
Nothing.
Not even a peep about what might happen in just a few days.
There is no mention of any regional banking crisis or concerns about Silicon Valley Bank, except for one blogger I found who wrote about this in October 2022 during the GILT Crisis and warned about it on Seeking Alpha.
I have not seen any mainstream media ever suggest before March 10, 2023 that there may be issues within the regional banking system.
But here’s a Google News search from March 8, 2023, to March 18, 2023…
One week later, it was full panic.
Nice to see that the financial media finally caught up on what was going on.
A week later, retail investors were dumping stocks at a massive rate.
Panic was in order. Regional banks got crushed. Several failed.
The media was NOWHERE on this one.
And then, the Fed opened the Discount Window. Retail investors were shell-shocked, but institutions and our Third Stool started buying at a massive rate.
Now… one more for good measure.
This is the big one.
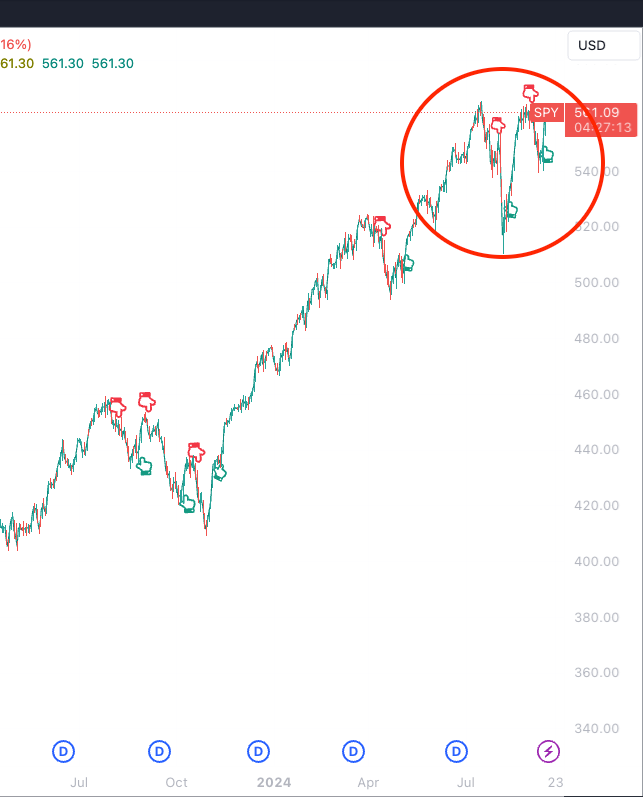
This just happened a month ago,
Right here. There was a sell-off on August 5, 2024,
You can see that money was moving out of the market ahead of that nosedive.
I explained a little short-term squeeze around July 30 to August 1.
There was selling ahead of a BIG EVENT, just like on March 7, 2023.
Money left the market, and then the crisis happened a week later.
Funds knew something was off. They were running ahead of this (almost like all that money they spend on political intelligence in Washington, D.C., really pays off).
Well, this signal was negative in the final hour of July 31.
It closed the day Yellow after a swing negative for a few hours on trading day.
It opened negative on August 1, and never looked back.
So, what happened on August 1st?
Nothing serious.
What happened on August 2nd?
Nothing serious, selling into the weekend.
We didn’t know why the signal was negative…
Yet….
We’d sure as hell find out what happened on August 5… three days later.
We saw the largest sell-off in the Nikkei since 1987, and the S&P 500 Volatility Index spiked to the highest level we’d had in a VERY LONG time. Here’s Yahoo! a week later:
Amidst the stock market sell-off last Monday, the CBOE Volatility Index (VIX) soared to 65.73, marking its highest level since the COVID-19 spike to 85.47 and the second-highest level since the late 2008 spike to 89.53.
Great work, media.
You were late as always.
Now, look at the slide below.
I’ve mapped this out to the signals from above.
Every single one of those negative market events (selloffs of 4%, 5% or more in the last three years alone) have transpired while a negative signal is in action.
The media has no clue what is going on.
They’re blaming jobs reports and macroeconomic data when what feels like 99.9% of the time it’s linked directly to liquidity, credit, and market plumbing… yet we don’t discover why until a week later.
For example, during the spike in yields heading into October 2023, the signal went negative in the first week of September.
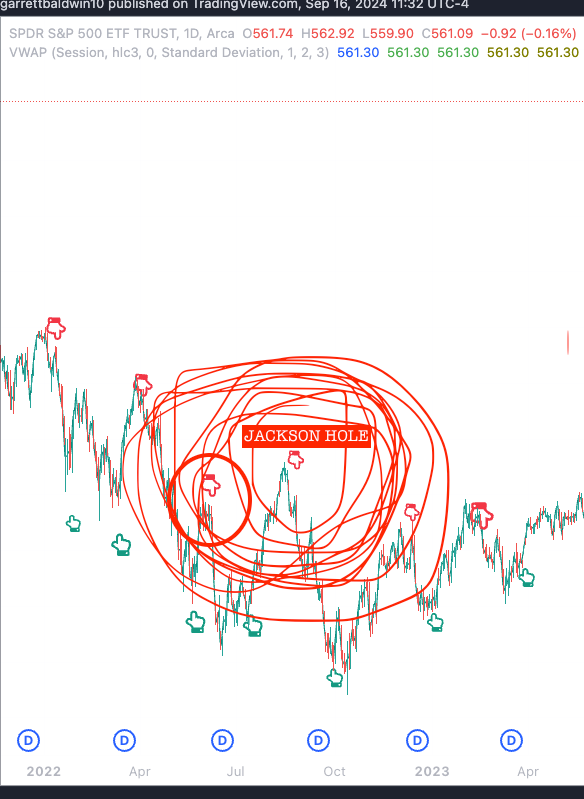
The accompanying negative signal ahead of the British GILT Crisis in October 2022 happened in late August 2022 when Fed Chair Jerome Powell spoke at Jackson Hole (when markets were at a massive top with little-to-no negative, aggressive selling. There was a noticeable squeeze after that record hedge fund selling in June 2022).
I went “Jackson Pollock style” on this Jackson Hole chart…
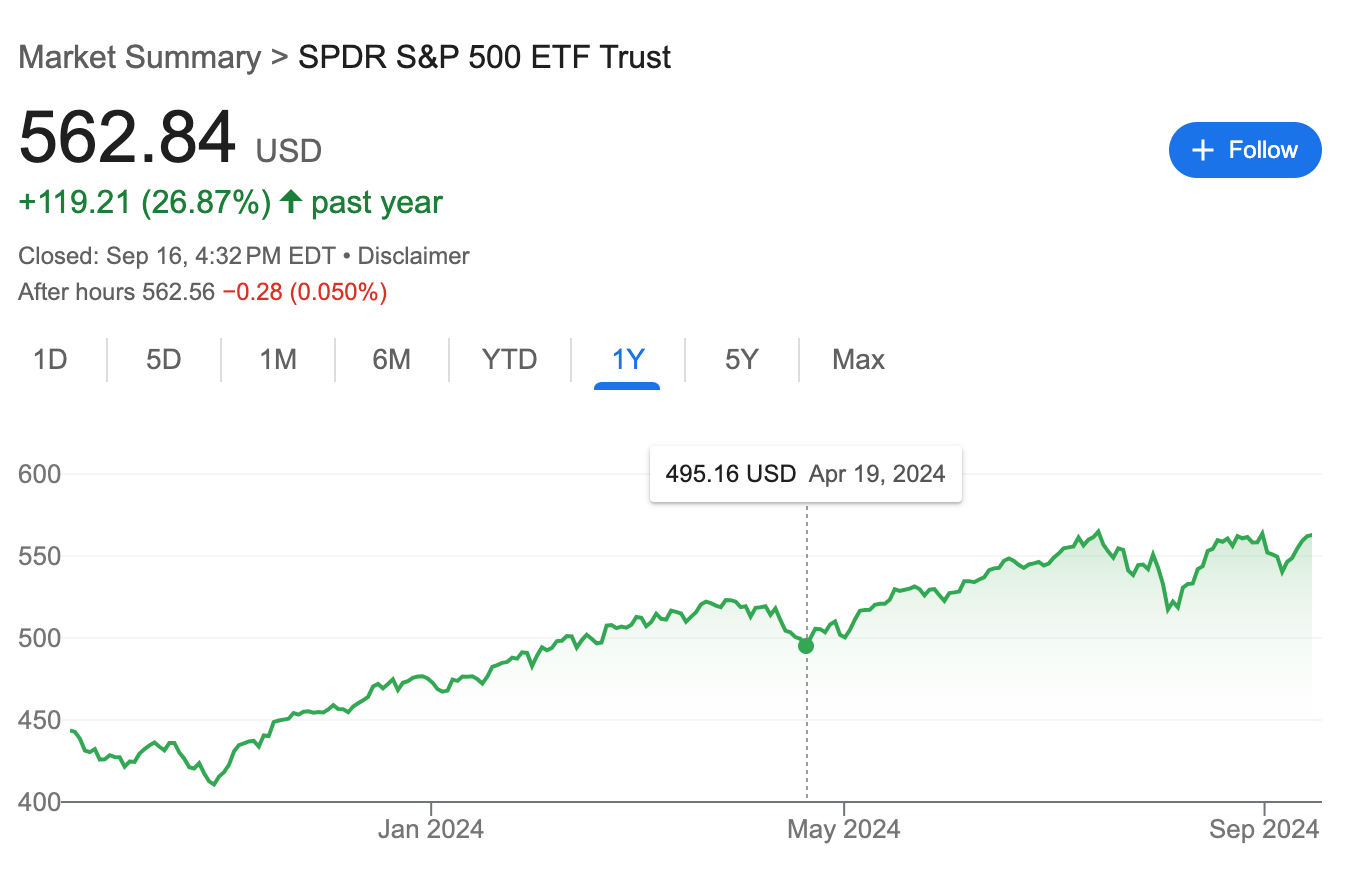
Now, go back to the April 2024 sell-off. The one driven by the need of investors to take money out of the markets to pay taxes (something that also happened in 2022).
This April selloff was well-telegraphed that there would be some problems in the banking system.
Reserves were under pressure already, and investors needed to take money out of the system to pay taxes thanks to a big move higher off that liquidity bottom that Howell outlined in October 2022.
There was a lot of money in the money markets… that was being plucked out to pay those taxes. Well, a lot of global private credit sources use the money markets for the origination of new liquidity that we've discussed.
We had a sizable sell-off in April when money was pulled from the system.
Then, on the backside of the tax day and April Options Expiration, what happened?
Treasury Secretary Janet Yellen got involved. Barron’s was about a week late from the bottom, but they largely got it right. But by that time, retail investors were panicking again. From April 26, 2024:
No Rate Cuts? No Worries. Uncle Sam Has Dough to Disburse.
Yellen and Company started using the Treasury General Account and engaging in support on the fiscal side (in a way that mimicked about a 100-basis point rate cut, according to Dr. Nouriel Roubini).
The market took off on the backside of Third Friday options expiration in April.
Are you starting to see how this works?
Opportunity Ahead
Now, here’s where it gets really interesting.
Keep reading.
There's a stock that is very tied to all of this.
You're going to be really blown away by the fact that once we pull all of this together, you're only going to want to trade this one particular stock because it absolutely takes off every single time that there is a crisis averted largely by central banks and largely by an expansion in global liquidity.
Before we get there: My argument to JD Henning is that his signal and multi-variate approach doesn’t just predict or avoid “drawdowns” in the traditional sense.
Yes, his multivariate analysis and research show that you can time markets on the downside, particularly in negative reversal events.
But… those downturns align with Michael Howell’s measurements of liquidity in the global markets and collateral quality (which impacts the flow of money into equity markets… since “money moves markets.”)
When these events happen—in Howell’s analysis of liquidity and Henning’s analysis of his defined drawdowns—there’s always a rush to cash (the dollar) and whatever that event is (which benefits bullish dollar funds like the UUP).
I believe that if you go back and look at the work that Henning has done in advancing this academic approach, his greatest accomplishment came in 2018 when the Repo Crisis hit.
His signals fully predicted those market downturns, and he recommended that people move to cash at the time… which he does in his active trading of his signals.
When I started to really study his work in 2019, when we started experimenting with this, and when we built something similar… The first NEGATIVE signal that we ever had came around February 21, 2020… after months of blue-sky breakouts and the markets largely ignoring any news out of China about the advancement of COVID.
I remember looking at the data that weekend and thinking…
Wait… something’s really wrong here.
There hadn’t been a shutdown yet.
In fact, New York didn’t shut down until March 15, 2020.
There wasn’t widespread panic yet. The markets had just hit a record high.
But money started to flow out in that final week of February at a very brutal pace.
This negative event was clearly linked to global credit, concerns about real estate, valuation pressures, fear of forced selling, and much more due to COVID and fear of shutdown.
Funds sold fast, before retail traders could blink (and forced selling followed).
This rough signal we had didn’t turn positive again until the second week of April.
And why did it turn positive?
The same reason that the comedian outlined above.
The Fed was pumping trillions of dollars into the financial markets.
That… was a massive pivot by the central banks - and we’re using the term pivot - as anything that accommodates the markets and the global liquidity system.
Here is April 2023, the regional banking crisis; what is that positive Green turn that follows the selloff just a few weeks later?
TradingView
That is when the Federal Reserve opened a discount window for regional banks.
Here is the event that just recently transpired with the Nikkei.
The rebound comes after Japan’s central bank issued a statement suggesting they wouldn’t take more action until the market could handle it.
I think the most recent negative turn is important and linked to China and its debt deflation challenges. And what has transpired in the last week?
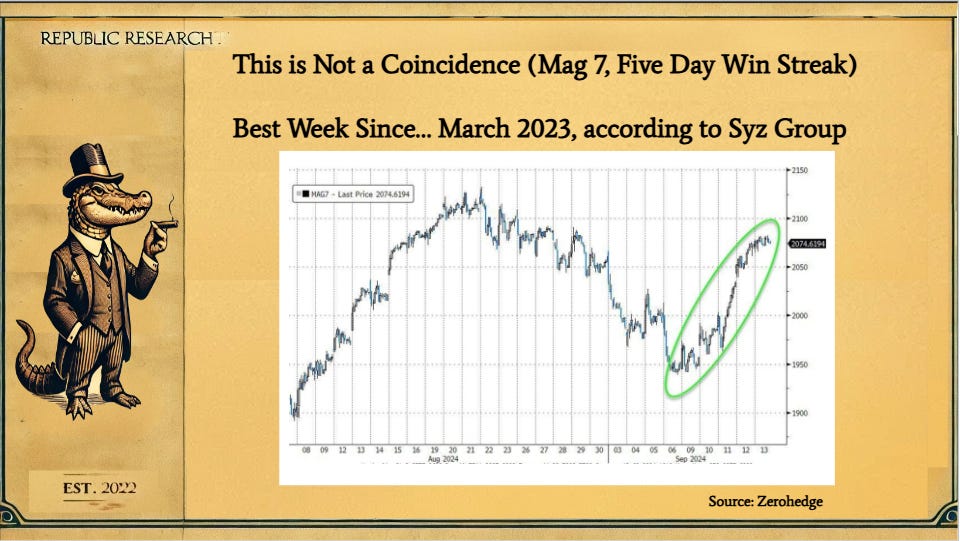
The MAG7 just had its best five-day winning streak since March 2023.
What happened in March: The 2023 regional banking crisis and accommodation.
With more capital and liquidity in the system, MAG7 benefited immediately after the Fed took action (And refused to call this move a bailout… which is laughable).
So, I hypothesize that something happened in the last week.
It could be that China has operated in coordination to provide support to the global economy. We saw some repo activity from China. The Financial Times said we need to add $1.4 trillion in money pumping from the People's Bank of China.
Think something's happening?
Do you think there might have been something like in 2016 when the S&P 500 cratered in late 2015 because of a debt deflation crisis that transpired in China, and then they had the Shanghai Accord?
At that time, all the central banks got together and coordinated.
And then the S&P 500 from around January 2016 just takes off the rest of the year?
Is that a coincidence?
Now, it doesn't mean that the worst is over.
Of course not.
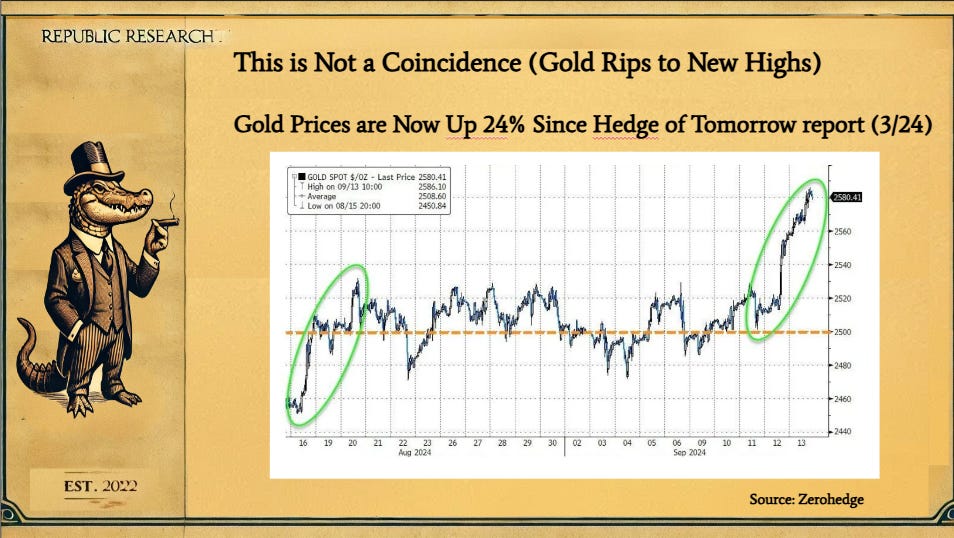
But something happened because gold is ripping upward as a clue as well.
Gold had moved from the Howell-defined liquidity bottom in October 2022, when it was $1,600, to $2,600 today.
That is not because everybody wants gold. Yes, central banks have bought a ton of gold, the most since before the end of the Gold Standard.
Much of this concerns the broad expansion in liquidity, which added $9.5 trillion.
You have the demand side from the central banks.
Absolutely.
But this is ALSO clearly a monetary inflation issue.
The price of gold from late 2022 went up $1,000, one of the biggest percentage moves in history in a short period of time.
We cannot just sit here and say, "Oh, well, you know, it's just that, people are worried about a recession."
Let me tell you something.
Gold doesn't do great when there are ugly liquidity events or big liquidity events.
Gold doesn't go through the roof.
No, it's like any other asset that people dump if they need cash now.
Gold prices benefit from this constant state of monetary expansion (fiat printing).
But, without further ado, let’s keep going.
Let’s go to the third leg of our stool.
This is our godsend factor for identifying market bottoms.
It is the perfect market timing signal.
It is the thing you need to watch every single day like it’s Christmas Eve, and you’re staring at the fireplace thinking of Santa Claus.
Follow Insider Buying.
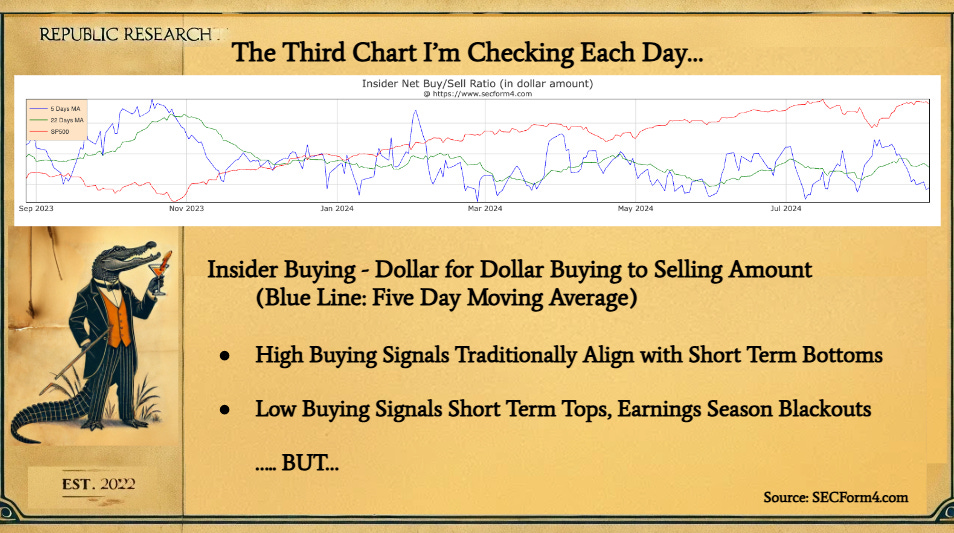
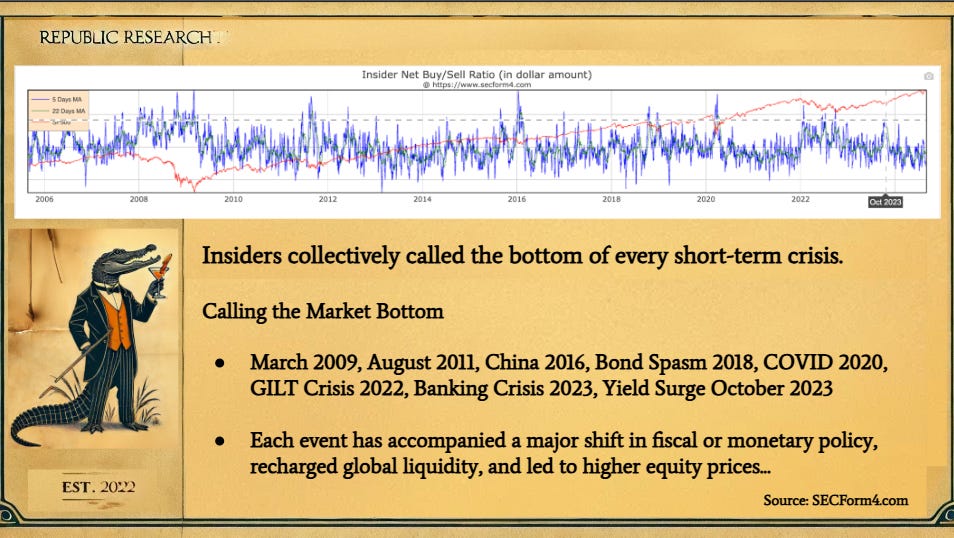
Let’s look at the third chart I eye every day.
The chart above is on SEC Form 4.
The chart above is the insider buying to selling, dollar-for-dollar amount.
It’s an aggregate chart of total insider buying to selling.
The higher the Blue line, the more extreme the levels of insider buying are market-wide (this specific chart follows the S&P 500).
This is every dollar executives at their own company buy their stock with their own money versus how much money they get by selling their stock.
They’re putting their own money down to buy the stock with cash.
Before we dissect it, it's very important to remember that many technology executives are paid in stock.
So, when they sell the stock, it counts as insider selling.
When insiders buy… they’re really buying. They’re overcoming the selling from the tech sector. When that blue line is at the top, it showcases extreme bullishness.
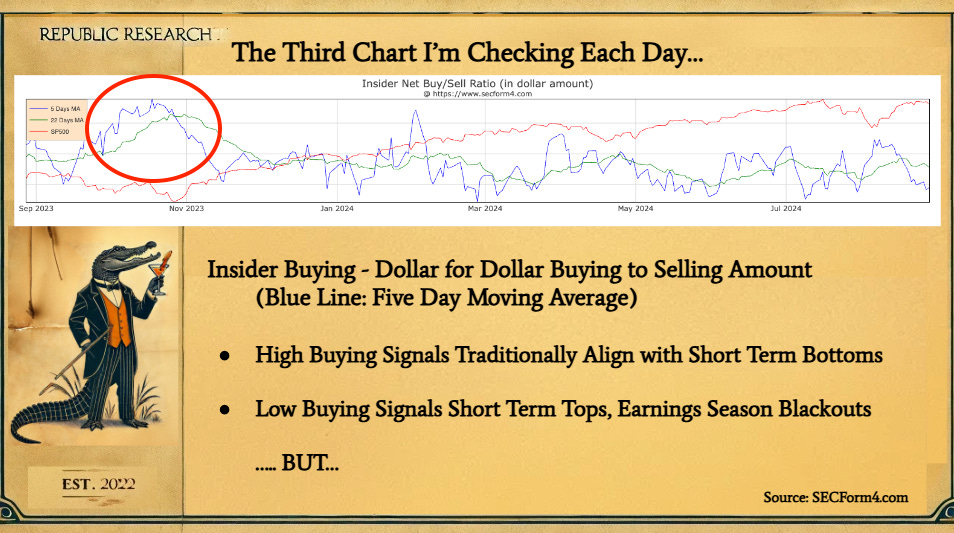
If we look back over the last year, we can see how strong the aggregate insider buying was in late October 2023.
That was the short-term bottom of the 2023 bond spike to 5%.
That was when there was a negative signal, money was flushing out of equities, and there were issues with collateral quality (as defined by Howell at the time).
The corporate insiders returned (right around when Bill Ackman was putting a lid on that panic, too).
The insiders collectively said: “We’re buying, this situation is overdone.”
The market bottomed out about a week later.
Look at the red line.
That's the S&P 500, which rallies in the April selloff period.
Look at how much buying there was from executives' blue line, which is the five-day moving average.
Look how the market took off afterward.
High insider buying signals typically align with short-term bottoms.
Low buying signals align with short-term tops, earnings season blackouts, or a lack of interest.
What was the last major event in the last month and a half?
This is the Nikkei crisis in the orange circle above.
Look at the spike in insider buying to selling in dollar amount (blue line).
Then remember the central banking activity done by the Bank of Japan.
The Bank of Japan soon said, "We're not going to raise rates until the market can handle it."
Soft Pivot!
It’s not a huge move, but it's enough of a short-term signal.
Money's coming in, and executives are bullish.
But let’s scale back all of this…
Let’s look at aggregative Buying to Selling all the way back to 2006.
This is the most important chart in all of finance.
Insider buying-to-selling blue line, five-day moving average dating back to 2006.
Look at where it is strongest: Start in March 2009.
That is the beginning of QE1 by the Federal Reserve.
That is where the Fed started QE and was soon expanded.
They started aggressively injecting capital directly into the system through Open Market Operations.
Everybody bought the previous spike (October 2008), just to the left of that March spike.
That previous strong buying period was right after Lehman Brother’s collapse.
That's all of the executives buying back into the market simultaneously.
They’re betting on central bank intervention, or they know it’s coming.
It took time in 2008. Congress had a failed bailout vote, and it took awhile to get everyone on board for this $787 billion stimulus, whatever the hell that thing was.
Then, the Fed’s direct action targeted credit and liquidity in the global system.
Insider buying really came at that market bottom.
Now, let’s move on to this one…
This is late 2011.
This is the European Debt crisis and the U.S. debt ceiling crisis.
Buying was very strong when the ECB started getting involved in preventing a debt crisis across Greece and other struggling, debt-ridden economies.
We started seeing more central bank activity in the following years. Then ECB head Mario Draghi basically screamed “YOLO” and started dropping money from the sky while abandoning austerity across the Eurozone a few years later.
It was a hell of a bull market for three years.
Then there’s the China crash in late 2015…
Followed by the Shanghai Accord in early 2016.
This orange circle above is where China crashes out.
We saw a big December 2015 drop in the S&P 500 and the Shanghai Accord.
It's funny because, in March of 2016, Marketwatch and a couple of other media outlets asked: “Was there some central bank event that we don't know about that?”
Yes. Of course, there was. The media has no clue what is happening.
There's no real confirmation, but sure enough, that was the market bottom, and sure enough, all of the executives were buying their stock at the strongest level that we have witnessed in the S&P 500 going back to the 2009 financial crisis.
Next up… there’s the Repo Crisis of 2018, two periods of strong buying in Q4.
This is the end of September and December of that year.
Insider buying was calling the bottom and a Fed pivot.
The Fed started cutting interest rates back from just 2.5%.
You don't need me to tell you anything about COVID-19 in 2020 and the associated insider buying.
The U.S. dropped trillions of dollars from the sky.
Other governments, too.
Buying peaks around when you had the Bill Ackman "hell is coming" statement on CNBC.
I recall that the bottom was March 25, 2020.
Soon, you had Neel Kashkari, Federal Reserve president from Minneapolis, going to 60 Minutes and effectively saying: "We got unlimited money, bud. We're just going to hit a number on the computer and we're going to start jacking this thing up."
The Fed was worried about bank runs.
The story goes that a man in the Dakotas or Montana walked into a bank and demanded $600,000 in cash. Funny enough, I never heard that story ever again.
Pivot!
That's where the insider buying really kicks up the final week of March.
And then all this capital starts flushing back in.
We get a positive Equity Strength Signal about two or three weeks later.
And the S&P is then off to the races.
The one false move we saw was at the beginning of January 2022 because everybody thought and believed Powell that we only needed a 25 basis point hike to manage inflationary expectations.
Obviously, that was wrong, but just because the insiders were wrong the first time doesn't mean they will be incorrect the next time. (See post-Lehman Brothers)
In the second half of 2022, there was a very strong period of insider buying with two notable pops in June and October 2022.
As you can see, we had the market liquidity bottom here as Michael Howell has defined it, and we were off to the races again.
Finally, we saw strong insider buying in October 2023 and a couple of spikes in that one-year chart that I showed to start Part Three of our conversation.
So again, insiders have called the market bottom in every major short term crisis.
Those periods are in '09, '11, '16, the bond spasm in '18 COVID, the Gilt Crisis in 2022, the regional banking crisis in 2023, and that yield surge in 2023.
Each event has accompanied a shift in fiscal and/or monetary policy.
It has recharged global liquidity, and it has moved equity prices higher.
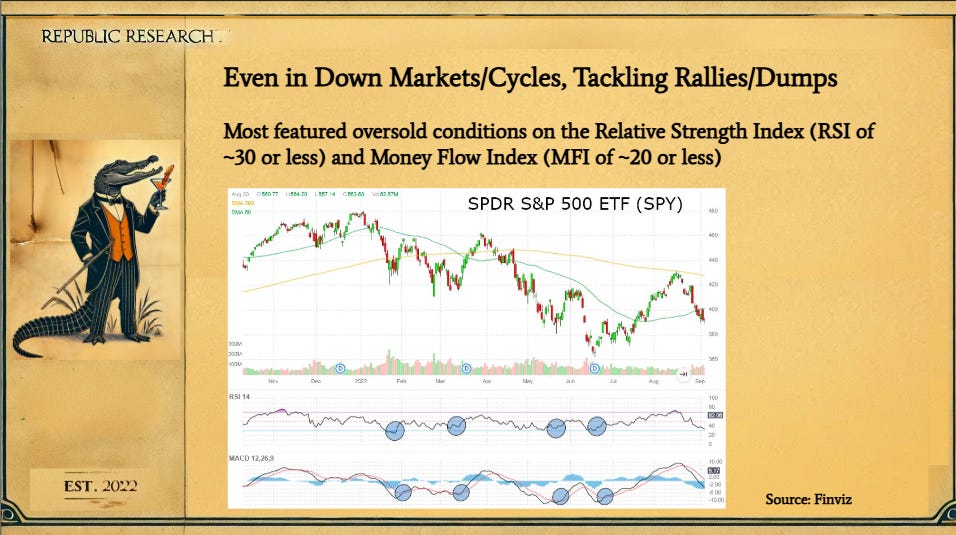
But let’s just add one more momentum element.
Reversion momentum: With all these down cycles, the index moves lower and lower; but, we have seen squeezes repeatedly.
This goes back to Grant Henning's book Trading Stocks By the Numbers, which teaches us about the Relative Strength Index and the Money Flow Index.
You’ll see oversold territory when the the Relative Strength Index hits 30 or under. (That’s the first group of circles).
I'm looking at the MACD on the second line of circles (I should be looking at the Money Flow Index).
But oversold on the MFI is 20 or less.
We want to see them both oversold at the same time.
If we look at the RSI and MFI getting into oversold simultaneously, we should just wait until we start to see the MACD turning positive and the ADX turning green.
We now have these short-term pops out of oversold.
The market never goes down in straight lines. There are multiple major sell-offs.
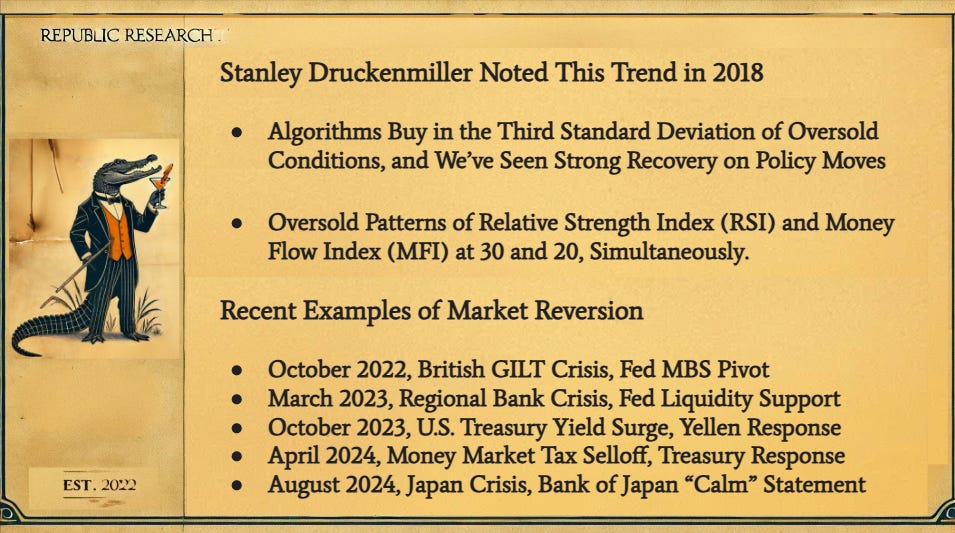
As Stanley Druckenmiller pointed out in 2018, what transpired when things get oversold is that the algorithms start to buy when things get into the third standard deviation during oversold periods.
They start buying everything up to cover short positions and squeezing, and people who were short were soon in trouble.
Everyone's trying to follow the algorithms, buying up all the shorted stuff.
They buy in these short-term periods, and then they suck everybody back in…
But keep in mind:
As Josh Hawes told me… “Don’t forget, the purpose of a market is to sell.”
So… they’ll sell all over again. We repeated that pattern a few times in 2022.
Druckenmiller pointed this trend out in 2018.
Algos like to buy in the third standard deviation of oversold.
Eventually, we see some sort of central bank or policy shift like in October 2022. There was a Bank of England pivot during the British GILT price crisis.
In March 2023, you had a regional banking crisis.
The Fed provides liquidity support to the regional banks.
The market reverted out of the oversold October 2023 yield surge.
The 2024 money market tax sell-off treasury came back off the top roof with the TGA, as Yellen responded.
The most recent event, the Nikkei event that transpired on August 5, saw the Bank of Japan say, “Oh yeah, maybe we're not going to do this today.”
We moved oversold quickly on the hourly charts… and it was over like that.
Then the market reverted, and everybody was thinking: “What the hell's going on?“
Well. A strictly worded central bank statement can fuel that sort of reversion.
Retail misses this constantly.
We had that huge sell-off in early August.
Retail investors, I believe, sold about $1 billion in stock in that panic.
The institutions bought $10 billion.
That’s how it always works.
Challenging Narratives
Let's go back to the concept of challenging narratives.
Remember these questions? Let’s answer them.
First: Do valuations matter?
That depends. P/E ratio doesn’t matter to me. EV/EBIT sure does.
The P/E ratio hasn't really mattered in the last decade and a half. P/E ratios are overrated, especially if companies use their cash flow to buy more to reinvest into their business.
Amazon (AMZN) and NVIDIA (NVDA) are the poster children of this.
They’re building equity value…
Next: Does information lead to better decision-making?
Not if you have a worldview.
I don't need to sit here and spend countless hours looking at the underlying fundamentals of certain companies.
What are these value drivers that work?
That’s why I centered my story about Enterprise Product Partners on the core value drivers.
If there’s a catalyst in the news, I’ll start to quantify it from there.
I don’t need to be overburdened by brand-new information, especially the type that will lead to irrational and emotional decisions from other market participants.
Next: Are markets so random that market timing is impossible?
-
No. Henning laid this out.
-
Howell's laid this out.
-
I'm laying this out.
-
Insider buyers are laying this out.
Okay: Are markets efficient?
Absolutely not. They are irrational.
People are irrational.
Even the algos are irrational, but we are all tied to how this underlying system works.
Next: Do earnings and rate policy really drive markets?
No. Liquidity drives markets, says Stanley Druckenmiller.
Money moves markets, says Howell, formerly at Salomon brothers.
Subscribe
Putting It All Together
Let's talk about this thesis.
What do you own?
What do you want to buy?
First, buy everything that's not nailed down with your fiat currency, and then nail that stuff down so that it’s yours. I’ve legitimately been buying many rare baseball cards because that cycle will come back at some point.
They’re mine, they’re rare, and they’re finite.
Find something similar. Nail it all down.
But let’s look at Real Assets and High-Quality Blue Chip stocks.
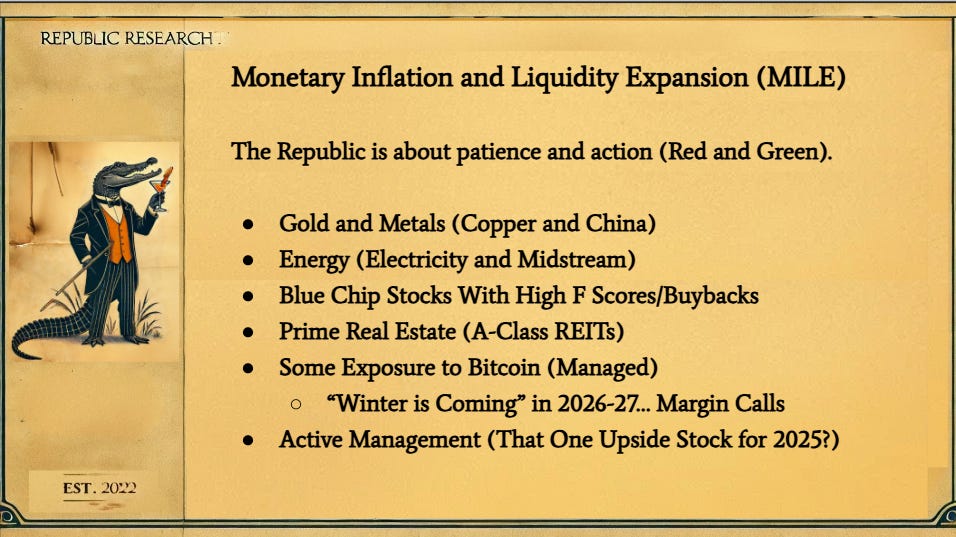
Within this concept of monetary inflation and liquidity expansion (MILE), you have to be patient.
You got to know, all right, is there an event transpiring?
From a signal perspective - risk on or risk off - are you red and green?
And if you're just turning green after a selloff, then you start buying assets.
And here you have a menu of simple, promising assets.
Gold is great on this theory.
You're seeing the central banks engage in this.
But also look at industrial metals.
If China is about to pump a significant amount of money, and we looked at what transpired recently, copper prices moved back above $4.00.
If the People's Bank of China is pumping, it's no coincidence that copper prices move higher. This economy is heavily driven by manufacturing. My boss at a Procurement Consulting firm taught me this concept in early 2009 when QE started.
It complements what Howell explains about the U.S., a financialized economy.
Every time the Fed pumps via QE or provides support, the action is very good for regional banks, especially for JPMorgan Chase CEO Jamie Dimon (who keeps getting to buy distressed regional banks for the price of a hot dog).
Next, look at electricity and midstream energy assets.
I don't care who you are and where you are.
If you're not investing in electricity generation or midstream oil and gas, you’re missing a generational opportunity.
Electricity prices are only going to move higher… and demand is only going to keep roaring.
That will result from the commodities linked to the electrification of our grid, massive AI demand, and forced government intervention in auto supply chains.
Midstream energy will be in constant demand, particularly natural gas, but even the elements that include methane gas, where they're putting these AI data centers in the middle of the energy deserts.
On the oil front, we need to move crude to the ports to sell it to international markets - it’s a critical export market for America over the next decade.
This is why I recommended Enterprise Product Partners (EPD) so vehemently.
Now, some Garrett and Tim talk: Next, blue chip stocks with high F scores and buybacks. Tim and I talk a lot about Piotroski's F score.
That was created by Stanford professor Joseph Piotroski back in 2002.
He created this poor man's momentum system where you get a score, it's quality score based on nine metrics.
It answers questions like:
Is the company improving its capital efficiency?
Are they buying back stock?
Are they paying down debt?
Are they increasing the dividend?
And these nine things, you get a point for each achievement.
Here’s Gurufocus and a screen of Enterprise Product Partners (EPD).
Gurufocus
You’ll find a lot of tech on the F score list today.
Names like Meta (META) and Salesforce (CRM).
Well, if you have a high F score, you're very capital-efficient.
You're buying back your stock.
You're paying down your debt.
If you look at the stocks that are really on fire right now, with these scores of 9, it's no coincidence that it's a lot of very high end of the S&P 500.
As blue chip S&P companies, they’ll absorb all of that monetary inflation that comes down the pipeline, all of that monetary expansion.
This money just moves through their balance sheets.
Plus, many of these companies have excessive market share in their sectors.
They're often part of duopolies, oligopolies, or straight-up monopolies.
Next: Prime real estate. They're not going to make any more of it. So again, class A REITs, pay attention to Brad Thomas at Seeking Alpha and Wide Moat.
I’ve known him for four years, and he’s the primary person I listen to on REITs.
On crypto: You want to have some exposure to Bitcoin, but we have seen Crypto Winters. Those bad periods tend to align with Howell’s liquidity cycles.
Based on the cycle forecasts, it’s fair to estimate that winter may come in 2026 and 2027. There’s a distinct expectation of a downturn in many of those alternative assets.
But then, when we get to the backside of this, like 2028-29, we should start to see an expansion in the liquidity cycle once again.
That will probably be the period that so many in decentralized systems have awaited. By then, we’ll be on the backside of the Hype Cycle on DeFi and decentralized systems, so we might actually see a deep undervaluation for these projects and lots of opportunity for everything else in the Ethereum system.
It will take a couple of years, but it should come back furiously when that money comes back. You’ll want to be prepared for that event.
And then…
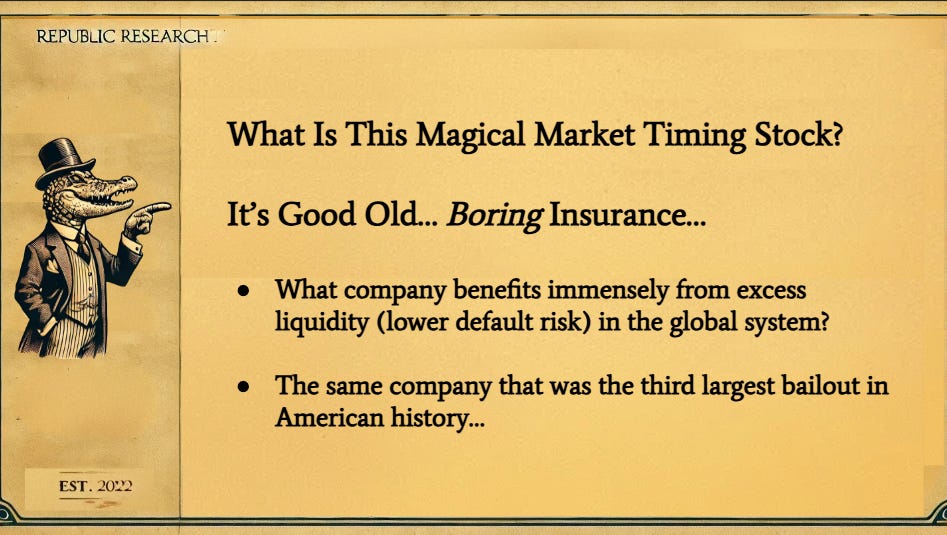
There was that last stock, right?
What was that magical market timing stock that I promised you?
And I said, we're going to draw from the bottom of the deck and pull an insurance company out of it.
What company benefits the most from improving liquidity conditions, which lower default risk in the global financial system?
What is the company that benefits immensely from excessive expansion of liquidity?
We care about lowering default risk globally because more capital is simultaneously in the system when one of those pivots occurs.
And I want you to remember this before we name the stock.
It is the company that was the third largest bailout in U.S. history.
The answer is AIG (AIG).
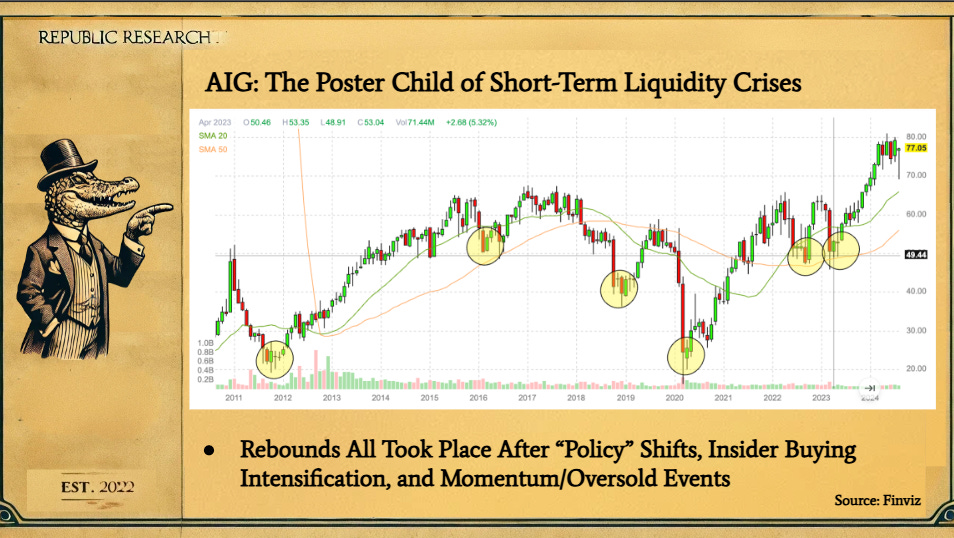
We saw a lineup of significant insider buying, with deeply oversold, negative momentum, and liquidity worries or panic in the system.
All three… lined up at the exact same time.
The first circle is the European Debt Crisis in 2011.
Look at AIG’s run from 2011 to 2015.
That’s a 200% run for AIG stock from an improving liquidity cycle.
The next circle is the China crisis and the Shanghai Accord in early 2016.
Post-Shanghai Accord AIG went from $49 to about $65 a share in a year.
Then, you have late 2018, after the Repo Crisis and the Fed cutting rates.
Concerns around global default risk dropped sharply.
The stock then goes from $40 to a little less than $60 in less than 6 months.
A 40-50 percent move.
Next is COVID-19 in 2020.
That’s the HUGE move down starting in LATE FEBRUARY.
AIG crashes under $20.
Then, once all of that capital comes into the market and the Fed drops the money from a helicopter, the comedian screams, “Why is the stock market going up? I thought businesses were going out of business. Everybody's home!”
Nobody was doing anything. Why was the market going up?
LIQUIDITY EXPANSION.
THEY PRINTED MONEY.
Then AIG went from $20 to $65 in two years and then hit the top of that cycle.
The next circle in late 2022 is the GILT Crisis and multiple central bank efforts to stabilize the system while fighting inflation. And there’s another pop into the late first quarter.
Next is the 2023 Regional Banking Crisis.
The Fed opens the discount window, and the stock goes from $50 to ~$80.
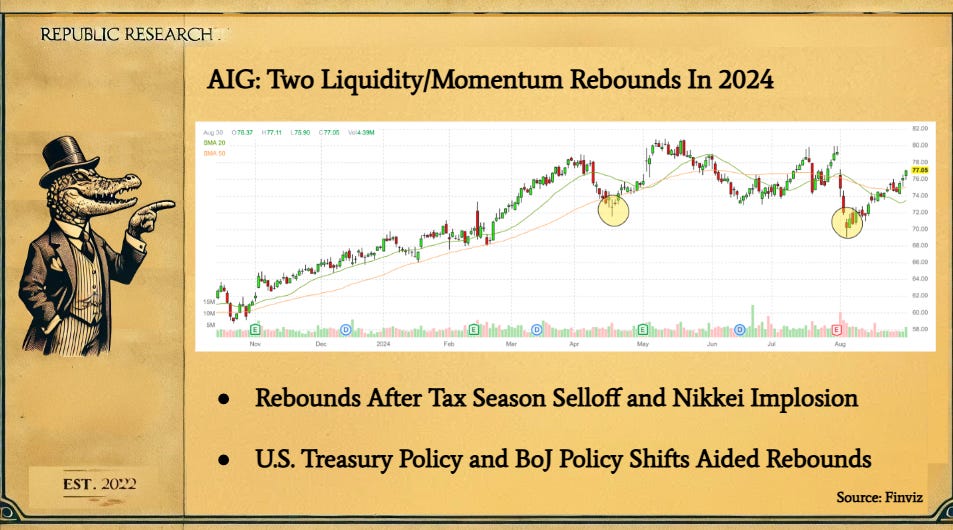
Let's look at the two most recent events that transpired this year.
Tax season sell-off in April 2024.
Then we saw the efforts to provide support by Treasury Secretary Janet Yellen and her work with the Treasury General Account (TGA).
The stock goes from about $72 to about $80 in about a month, a 10 percent move.
You can do a lot with call options on that.
And then the second circle is the Nikkei crash.
After the negative signal, we went from $80 to $70 in about three and a half days. And then the Bank of Japan changed its tune.
The stock turned around and went. from $67 to $77 per share in a month.
It makes sense that AIG would benefit, right? You see it?
There is a reduction in liquidity risk.
There is a reduction in default risk when you pivot and support the global system.
Remember, the system is designed to reach these outcomes.
When they provide that support, these are the outcomes.
The outcome is a 10 percent move in AIG back up in August.
That is the outcome it is designed to do because AIG once insured “half of the Western hemisphere's credit default swaps,” as Hank Paulson’s character in the film version of Too Big to Fail once said.
So, once again, the system is designed to perpetually support the global liquidity system.
The central bank is doing that independently and watching what's happening in the global shadow banking system and the broader system, as measured by Howell.
Now that's AIG.
I'm telling you, when you are watching blood in the streets, and you are watching people freaking out, and you're watching AIG fall.
If insiders start buying during these periods, pay attention. Look to see what sort of chatter is happening with the central banks. Read what Howell is saying about the hiccup. Look at signals to get a sense of outflows in the markets.
You also start to see the markets bottoming out RSI simultaneously, and they're going to pivot.
At that point, buy AIG because it benefits when these conditions align.
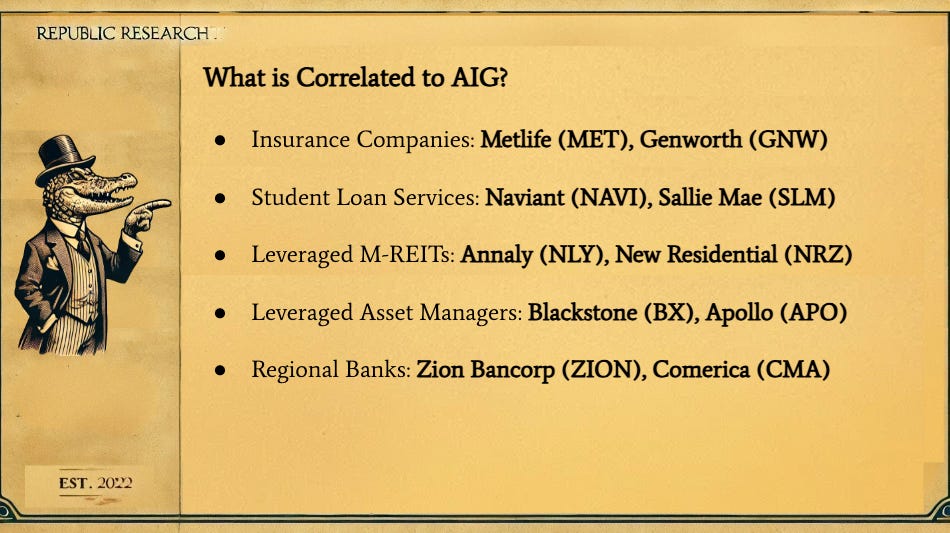
If you’re AIG averse… let’s look at what is correlated to AIG.
First, insurance companies.
Look at MetLife (MET) and Genworth (GNW).
Student loan services. How above Navient (NAVI) and Sallie Mae (SLM).
Leveraged mortgage REITs. Annaly. (NLY). I remember Tim recommending NLY, I believe it was around March 2023. This effort by the Fed in March 2023 and NLY has just been a dream for a lot of people in the last year and a half.
NLY hit i$14.70 during the bond flareup in October 2023.
It's back at $20.45 with a 12.7 percent dividend.
Well, that’s what happens when we constantly expand the base and prevent default risk.
I’m not saying there won’t be these problems in the future.
If these things get crushed, and there’s a massive round of QE, you know what stands to benefit and revert.
Leveraged asset managers. Look at Blackstone (BX) and look at Apollo (APO).
And, of course, look at regional banks since they benefit from U.S. Fed QE programs.
You've got a regional banking crisis, and the central bank starts to open up its discount window. Zion (ZION) was one of the survivors—one of the big survivors that transpired in 2023.
Remember that ZION was down in the regional crisis 2023, down to about $22.43.
It's back up at $46, with a 3.6% dividend. In the last year, it's up 26%.
It's done very well since that bottom in October 2023, when bonds hit 5%.
That’s why we focus on these names.
Let’s Wrap This Up.
This has been a long report. I’m aware.
This is my conclusion for you:
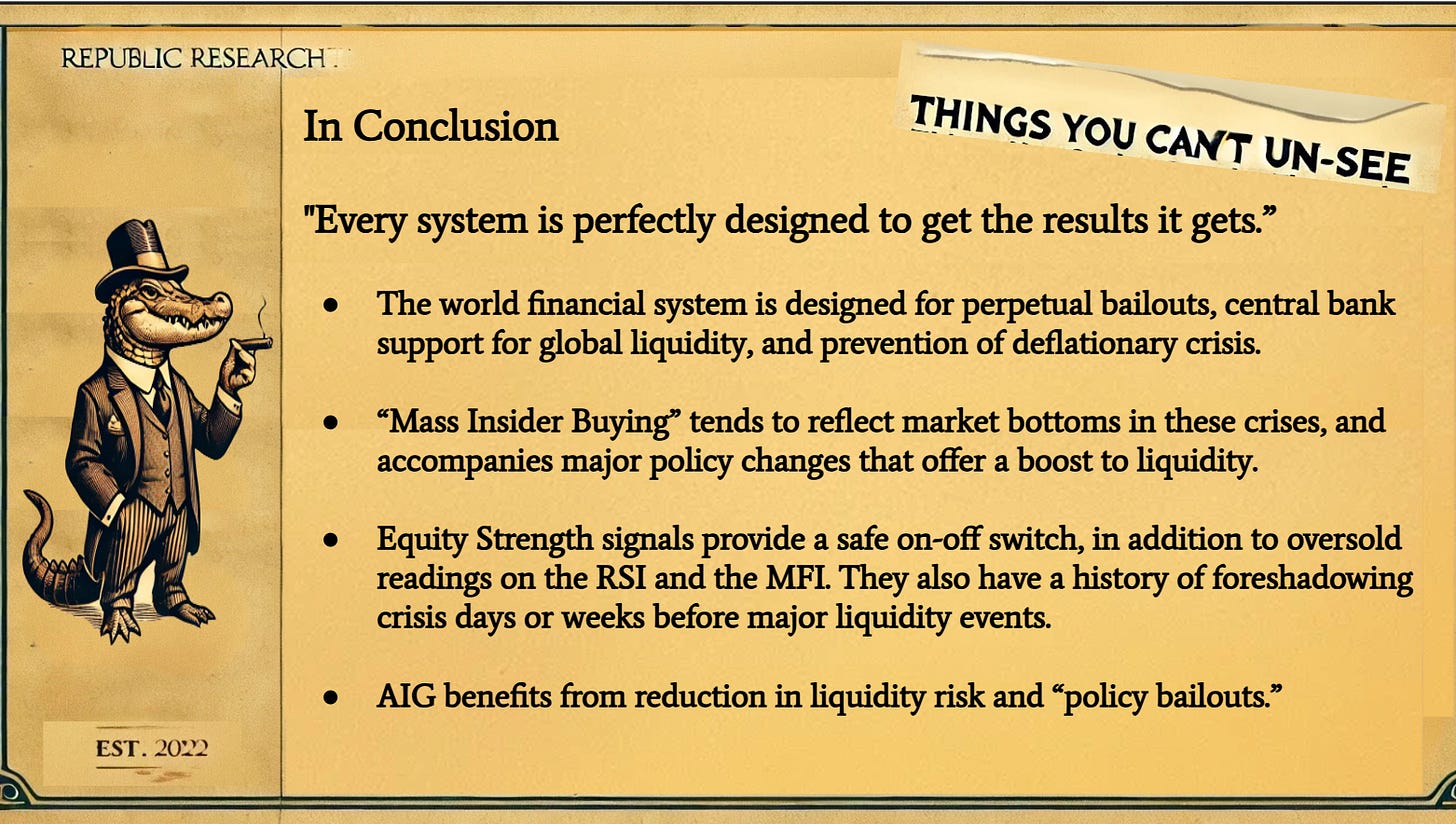
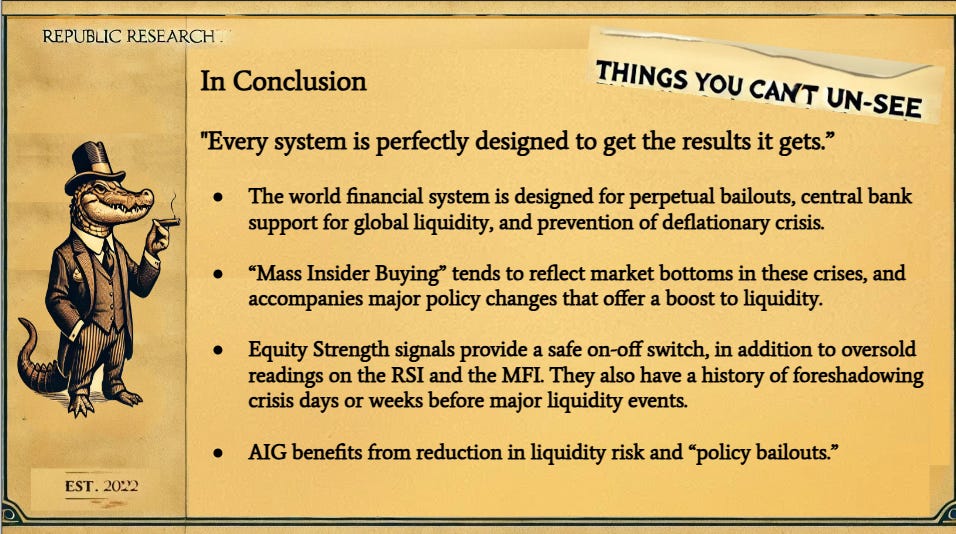
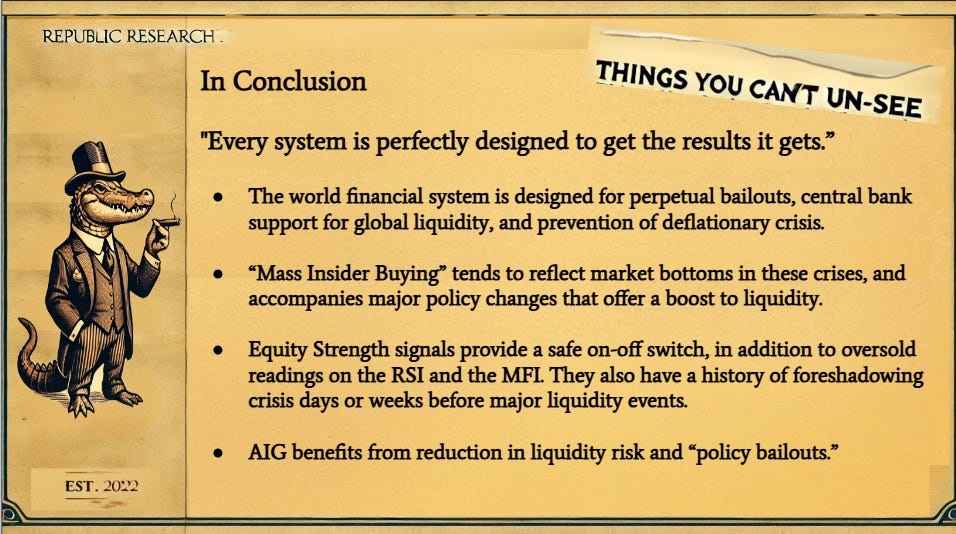
Every system is perfectly designed to get the results it gets.
And this is an indictment of this system.
This financial system is designed so that the central banks engage in ample liquidity support for the global system.
The world financial system is designed for perpetual bailouts.
I have lost confidence that they will ever let asset prices crash.
Now, you may want to trade this until it breaks.
Of course, you might think, wait a minute.
What if you're wrong that one time?
This is how it has been since 1970, and we went on the Fiat system.
Remember this chart…
This chart is my K Street Confidential idea - where the Fed and Lobbyists reside.
This is how politicians make so much money front-running fiscal and monetary policy decisions.
That’s the secret sauce.
When can they buy the Mag7 before there’s coordination on policy efforts?
You don’t think I’m buying everything that’s not nailed down the next time they inject $2 Trillion or $4 trillion… or what… a Quadrillion (at some point in my lifetime) into the markets on this crap fiat currency?
I’ll take the gains while our signals are green and then buy real assets.
This is how it has worked for seventy years.
But if we start to see a collapse in that system, well, you will have bigger problems than whether or not your AIG stock that you bought is down another 10%.
There will be more important things you’ll need to know.
You'll want to take at least some sort of farming class and learn how to make bread in an outdoor stove.
Don't worry about that until then. Trade it until it breaks.
Once again… Massive insider buying tends to reflect market bottoms in these crises and accompanies major policy shifts, both at the fiscal and monetary level that boost liquidity.
You can look at what Henning does, follow my friend Mark Sebastian on his focus at the VIX, or follow my other colleagues at Cantor Fitzgerald.
You can follow our equity strength signals, what we do, and what we talk about.
I don’t care who you use or who you follow. I’m just the messenger.
Well ahead of the curve…
So, if you want to run a hedge fund and devise a different method, go for it.
It's money coming in and money coming out, and no matter how you measure it,
It doesn't matter which way you measure it.
What matters is that it works.
If you see that RSI and MFI are oversold, and then you see what JD Henning pointed out, where you just have no acceleration, no significant buying.
Well, that might likely be the bottom, or maybe it will get a little bit worse.
But the moment that you see the Federal Reserve will start to engage in quantitative easing by everything that isn't nailed down, especially AIG, which benefits from a reduction in liquidity risk and this kind of policy bailouts.
My Sign Off
Here in the Republic, we say this with every sign-off that we have can stay positive.
And it means one of two things.
It means, well, hopefully, money coming into the market remains.
We will stay positive regarding how we view equity strength or liquidity flushing into the system.
We want it to be positive, but when it's negative, we want to actually enjoy our lives.
We don't freak out when there are these negative events.
I can't tell you how many people I've met in the last few years who sell everything off and then say, “Wait a minute, why did the market move higher?”
I tried to explain it, and I just explained it to you.
Money moves markets, and when it flushes out, we don't know why it's happening in real-time.
CNBC will tell you as it did last week, "Well, the rebound (reversion) is because Nvidia’s CEO is bullish…”
Do you really think that the market rebounded because of NVIDIA?
Really?
Because the CEO of Nvidia said our demand is strong and we can't fail.
Like he is some member of a Disney family who must carry the world's weight on his shoulders.
No, something happened on the global front.
There will likely be coordination out of China, Japan, and the U.S., and there will probably be ongoing talks because China's deflation risk is serious.
We won’t know what it was for another week.
Yes, there are risks ahead.
There's going to be a lot of instability in the years ahead.
We have trillions of dollars that need to be refinanced in the market.
I said, what will be the next thing that causes a sell-off?
I can guess… But that’s it.
There are $2.5 trillion in CD deposits alone that need to be reallocated next year.
You have another $9 trillion that needs to be refinanced by the Treasury Department.
You have a debt deflation situation in China.
You have a lurking issue with the Japanese carry trade.
You also have deindustrialization across Europe because nobody seems to understand that the German economy was 2 trillion of GDP leveraged on about 20 billion of Russian natural gas.
I just wanted to set the record.
I wanted to explain my worldview, one shaped by a decade and a half of work.
There’s been a lot of reading and a lot of puzzle pieces put together over time.
I haven't been right the entire time along the way.
I've obviously made mistakes when it comes to trading, but I've been more right than I've been more wrong.
But now I see it.
I’ll get THESE moments where insider buying, liquidity, oversold conditions, and momentum reversion line up.
Sometimes, three times a year, usually two, maybe just one, we get a big reversal event that allows us to move a lot of cash back into the market.
I don't like to short, buy leverage, or try to time things too much to the downside.
If 2020 taught us anything, going into the weekend short was dangerous because central banks can engage in weekend meetings.
They did it a lot when they engaged in some new levels of quantitative ease in QE4 in March 2020. It is a dangerous game.
The key thing you can think of is that when we have these negative events, it's time to start building cash.
It's time to remember that cash is a position.
When these events occur, many people are looking to build cash simultaneously because they'll have to pay off or refinance short-term debt.
They're going to have to roll things over and refinance, and a lot of this is done globally in the U.S. dollar. At this moment, I don't believe the BRICS will overtake the U.S. dollar anytime soon, and I don't believe there will be any significant trade crisis anytime soon. I don’t think China wants the responsibility of managing the reserve currency (which is how and why the Fed’s role in global coordination is so important).
I still remain diligent about trying to stay on top of things just in case there is a BIG, but I’ll know it’s happening because it will show in momentum signals in other parts of the market, such as foreign currencies, emerging market equities, or leveraged bond ETFs.
I’ve been influenced by a lot of brilliant people since 2008.
So, let me thank them, as they have shaped my view, printed September 15th, 2024.
Why September 15?
I published this report on September 15 because this is an important day in my life.
First, this was the same date I met my wife 13 years ago.
It is also the same date as Lehman Brothers collapsed in 2008.
I remember walking up State Street in Chicago the day that Lehman happened.
I left New York in March 2008, two weeks before Bear Stearns collapsed.
And I thought the world was really truly ending back then.
I didn't really understand how central banks influenced the global monetary system… let alone how it actually operated.
I remember walking up State Street that morning in Chicago, and people were coming out of their buildings at 10:30 and 11:00 a.m.
Some people were drinking bottles of booze, some people were crying... some both.
I looked around and couldn’t understand what was happening in time.
I thought, “Well, there's a housing crisis.”
Okay, I've seen this before, but this was unique.
When you learn about AIG's bailouts and how much leverage there was in the system, you ultimately find out that September 15, 2008, was the day that capitalism died.
Since then, we have been on this massive level of monetary life support.
This constant rhythm pops and drops and bailouts, and everything comes with it.
Now, you can go back to 1971 or 1993, a pivotal year when this kind of monetary system really evolved with Inflation Targeting.
But it was 2008, this date, that really set the stage.
It was the start of Quantitative Easing and the Ben Bernanke rules that followed.
We’ve had countless rounds of QE, and the philosophy of liquidity backstopping the system has been adopted globally.
This is why housing prices have recovered the way that they have.
This is why food and the price of things that matter continue to explode.
It all starts at the front of the monetary curve.
So, anyone sitting here blaming grocery stores for high prices and inflation on lack of supply is actually in public policy, and they don't understand the impact of their policies.
It's very easy to blame high prices and CEO pay and all these other things on greed.
But that is so far down the monetary supply chain that you have to go back and listen to what Milton Friedman said.
“Inflation is and always will be a monetary phenomenon,” and it has been caused by central bank activity, monetary expansion, and fiscal stimulus.
At the end of the day, if you really want to know how and why things have gotten the way that they have, especially in recent years, it's because they printed too much damn money.
This is not that complicated.
But most people don’t know how monetary inflation persists.
Maybe they haven’t heard of Howell… or they’ve ignored Howell despite this very same thesis sitting at the center of Druckenmiller’s arguments for decades.
The same thesis was laid out at Solomon Brothers’ (where Howell worked) too.
Others will say: “Wait a minute. Well, the money supply has gone down, right?”
The M2 has gone down.
Not global liquidity. Not the way Howell defines it.
The way he defines it is that's where the M1 ends.
It's everything else globally. And you will need to do the reading to dig deeper.
-
I encourage you to read Capital Wars.
-
I encourage you to read JD Henning's dissertation.
-
I encourage you to follow what the Insiders are doing.
-
I encourage you to follow us at Postcards. (It’s free)
This is my worldview, and I will protect it.
Please let me know if you see anybody else running a promotion about it.
I'd like to have a conversation with them.
I hope that you enjoyed this presentation.
Once again, I am here to work.
I am not far from New York or DC and not sitting on the sideline anymore.
You will see me on camera a lot more here at Republic.
I do hope that my publishing partners will take this seriously.
Or, if an institution wants to talk, I’m always here to chat.
I hope that anyone else who is interested in being involved in this journey will learn how the markets work and utilize many different tools and strategies to take advantage of this system.
Send me an email at AJBCapitalResearch@gmail.com.
I hope that everybody has a wonderful day.
I look forward to more conversations with you in the future.
Take care and stay positive.
More By This Author:
You Party, I Party, Chart Party
A Gasoline Salesman in a Hurricane
Risk: A 50-Basis Point Cut And a Change of Shorts

