

Image Source: Pexels
The Jackson Hole Economic Symposium, hosted by the Federal Reserve Bank of Kansas City, is an annual event in which central bankers from the Fed and around the world gather with policymakers, economists, and financial market participants to discuss economic issues. At times, such as today, when monetary policy is in flux, the meetings serve as a way for the Fed to signal changes in its monetary policy directions. Accordingly, the opening speech from the Fed Chairman will be well followed. At this week’s meeting, the assumption is that Jerome Powell’s opening speech will show he is more likely to cut rates at the September FOMC meeting. Consider the following:
- Cooling Labor Market: The July BLS employment data and the sharply revised prior months point to much more weakness in the labor market than the data the Fed had in hand at their last FOMC meeting. In the past, Powell has noted that a weaker jobs outlook could prompt him to cut rates.
- Inflation: While PPI rose sharply, CPI and PCE are not yet rising to the point of concern for the Fed. Tariffs are certainly playing a role, but the initial readings do not confirm the Fed’s fears. That could change as more data comes to light.
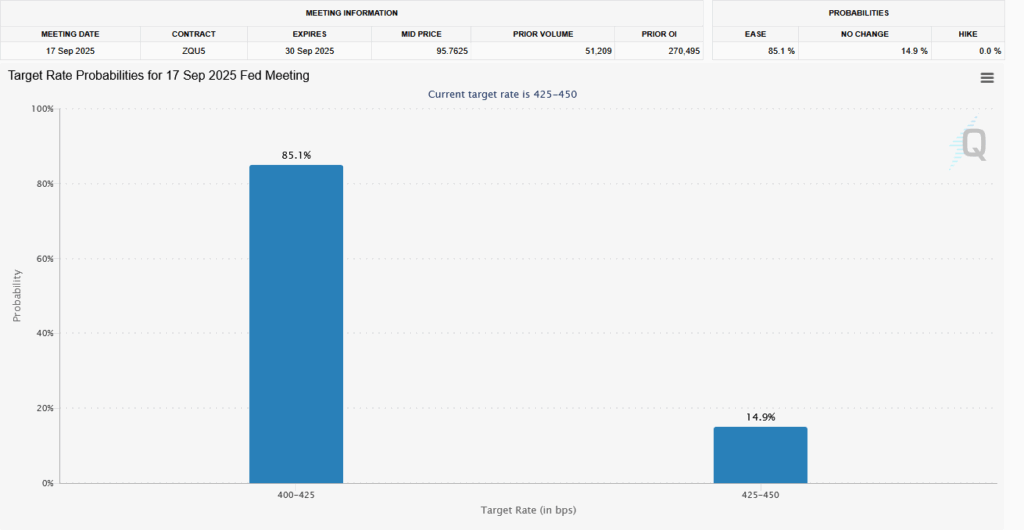
- Market Expectations: As we share below, the market is pretty certain (85%) that the Fed will cut rates in September. While Powell is likely to avoid making commitments to cut rates, he may want to steer markets in that direction and avoid creating volatility. Often, the Fed tries to lead the market toward the Fed’s current line of thinking.
- Political Pressure: We are not sure how much President Trump persuades Powell, but easing would relieve him of some political pressure.
(Click on image to enlarge)
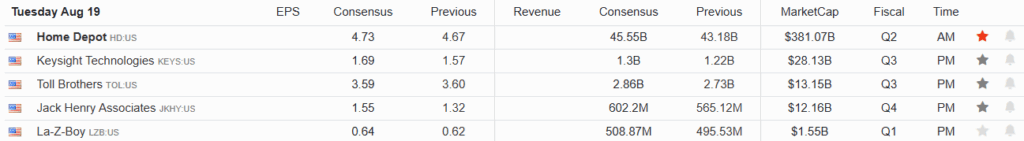
What To Watch Today
Earnings
(Click on image to enlarge)
Economy
(Click on image to enlarge)

Market Trading Update
In yesterday’s update, we discussed the market outlook for this week as we head into the last half of the month. As noted:
“From a technical perspective, the trend remains upward, but there are signs of weakness below the surface. A negative divergence is developing between the rising market and weakening relative strength. Simultaneously, money flows remain weak despite the higher stock grind over the last week. This does not mean the market is about to crash. It suggests that investors should deploy some form of risk management.”
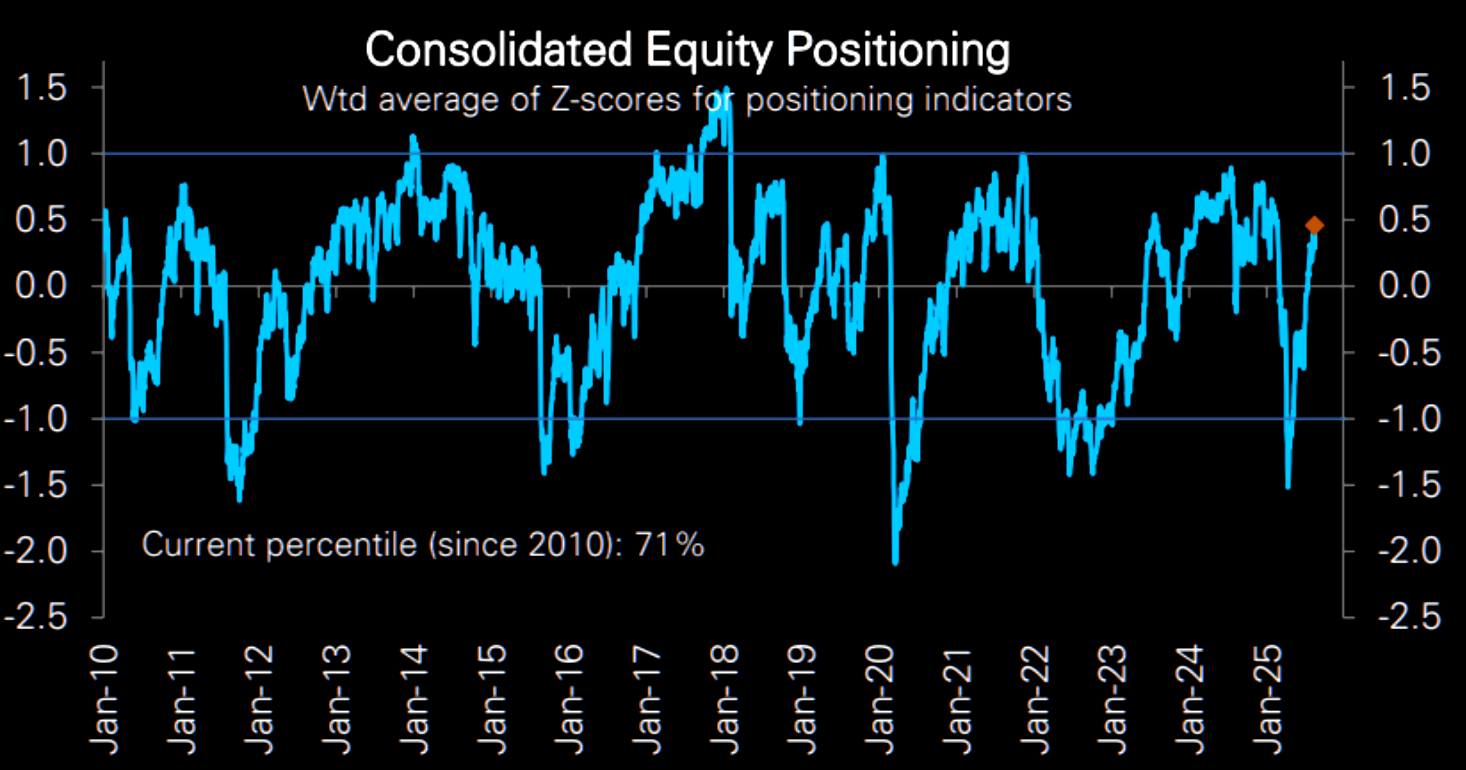
However, it is worth noting that overbought and bullish markets can remain that way for quite some time, making risk management more difficult to deploy. The reason is that psychologically, as the market continues to defy the odds, the more aggressive investors will become. Notably, while the market continues its bullish trajectory, it is worth noting that market sentiment surveys and hedge fund positioning data continue to be far from exuberant.
For example, consolidated equity positioning is not one sigma (standard deviation) above its mean.
(Click on image to enlarge)
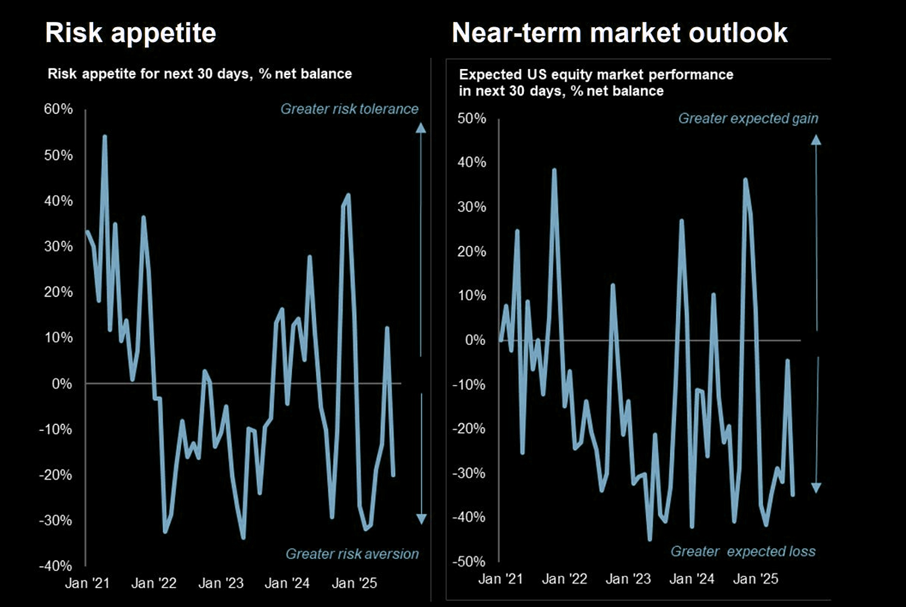
Investment manager sentiment is also far from exuberance. In fact, risk appetite and near-term market outlook have dropped back to quite pessimistic levels.
(Click on image to enlarge)
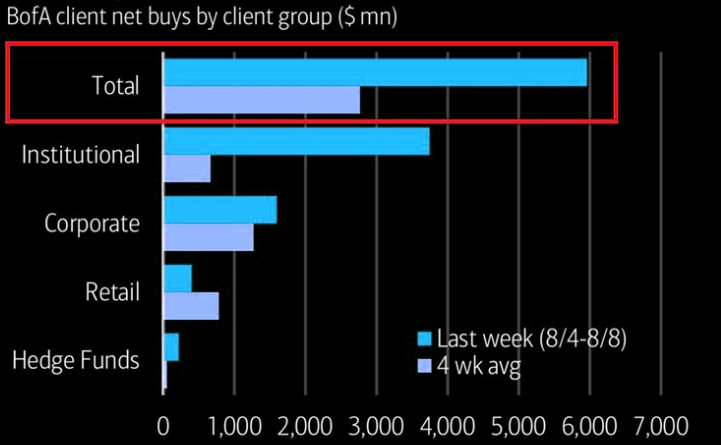
However, while professional investor sentiment remains more controlled, suggesting that there is upside risk in the current market, there has undoubtedly been a LOT of buying in the market as of late. Here are some of the latest stats:
- Total US ETF and single-stock purchases hit $5.9 billion last week, well above the 52-week average of $2.3 billion.
- This lifted the 4-week average of purchases to $2.8 billion.
- Institutional investors drove the surge, buying $3.7 billion, the 10th-largest weekly amount in at least 17 years.
- Corporations (buybacks) followed with $1.6 billion in purchases.
- Individual investors have now bought in 33 of the last 35 weeks.
While we remain in a very weak, low-volatility environment, the demand for equities remains strong. As such, it continues to pay to be invested in equities. How long that will be the case, no one knows. But in this market, selling too soon has been repeatedly punished. But eventually, risk management will pay its dividends.
Momentum Isn’t Always The Right Strategy In A Bullish Trend
Many investors tend to think that momentum strategies in upward-trending markets are a good bet. While that can be the case sometimes, it isn’t always. For example, in the current environment, we have seen rapid rotations between sectors and factors. Yet, despite sitting near record highs, momentum strategies have had middle-of-the-road relative scores.
Momentum strategies do best when price trends are persistent, and importantly, when a distinct group of stocks, be it sectors and/or factors, consistently lead the market higher. Momentum uses historical price data to assess momentum. Thus, when investors are rotating rapidly, buy signals can occur as the most popular sector or factor is peaking in popularity. Thus, momentum strategies pick up on trends when they are late in their cycle. Momentum works best when we can get those trends early in a cycle.
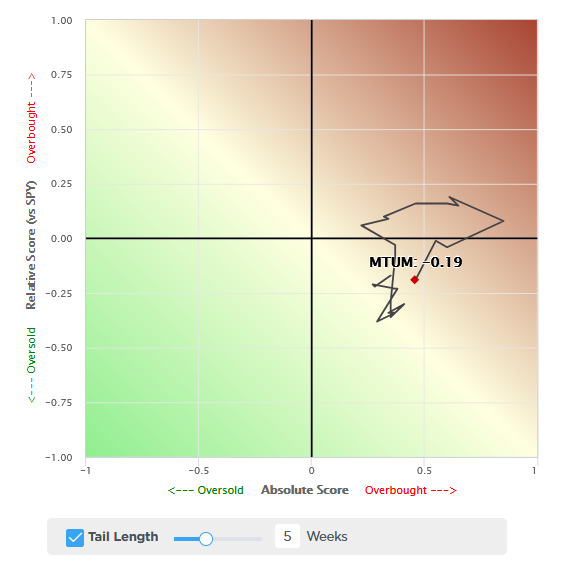
As we share below from SimpleVisor, the momentum factor is slightly oversold versus the market. Furthermore, its absolute score is overbought, but decently below the higher beta and large-cap growth stocks currently leading the market. We can see why the momentum strategy is underperforming in the second graph. While it does have market-leading stocks like PLTR, META, and AVGO, it also holds yesterday’s leaders like PM and NFLX.

Excess Bullishness & 10 Rules To Navigate It
There is little doubt that excess bullishness has invaded the general market psyche. Just a couple of months following the market decline in March and April, where sentiment turned exceedingly bearish, the S&P 500 hovers near its highs. Furthermore, analysts are rushing to raise price targets to 7,000 or more. Nicholas Colas of DataTrek notes that sector correlations, a reliable signal of investor confidence peaks, are moving toward levels seen before tops in 2023, 2024, and February 2025.
Furthermore, growth stocks continue to outperform value by a wide margin. As noted in the Daily Market Commentary, dominance is driven by Big Tech, which accounts for nearly half of the S&P 500’s recent gains.
“Like an iceberg where we only witness the 10% rising above the water, the passive index concentration hides underlying weakness. Equal-weight versions of the S&P 500, which give each stock the same importance, are underperforming. That shows that the broader market is struggling outside of the top names. When gains are so concentrated, the market’s foundation is narrower than it appears.”
(Click on image to enlarge)

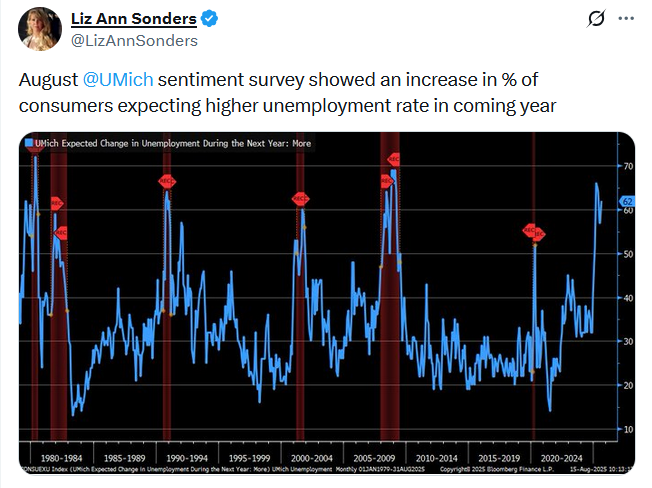
Tweet of the Day
More By This Author:
Excess Bullishness & 10 Rules To Navigate It
Euro Stocks Are In Vogue: Do Valuations Justify The Rotation?
Inflation Data Sends Markets To New Highs


Comments
Log in or sign up to join the conversation.