

Image Source: Unsplash
Since 2015, the performance of the S&P 500 has been more than double that of stocks from the Euro STOXX 50 (FEZ) and the iShares developed markets ETF (EFA). However, recently the tide has turned, and the Euro and broader foreign stock indices are beating the S&P 500. The recent outperformance and significant valuation differences have some media pundits calling for a continued rotation from US stocks to foreign developed stocks. To their point, FEZ has a P/E of 11 and EFA of 13, both of which are nearly half of the S&P 500.
Valuations, without the perspective of future growth, are worthless. Would you rather buy grocery store A for two times last year’s earnings or grocery store B for five times last year’s earnings? The question is impossible to answer without knowing how their sales and profits are growing. What if store A’s earnings growth has been flat for ten years, while store B’s have been expanding at a 20% clip and are expected to continue to do so? Similarly, when we look at market valuations like P/E, we also need to consider earnings growth.
From 2015 to 2025, the S&P 500 earnings growth has ranged between 8% and 12%, while the Euro and developed stock markets have been less than half that at 3% to 6%. This leads us to productivity and the graph below. Ultimately, productivity growth drives economic growth, which drives earnings. Thus, the S&P 500 has a much higher valuation because it has more earnings growth. However, more importantly, investors are willing to pay more for S&P earnings in part due to the significant difference in productivity growth between the US and the euro region.

What To Watch Today
Earnings
- No earnings reports today
Economy
(Click on image to enlarge)
![]()
Market Trading Update
U.S. equities notched fresh milestones midweek before fading into Friday’s close. The July CPI print (headline +0.2% m/m, +2.7% y/y; core +0.3% m/m, +3.1% y/y) kept the “September cut” narrative intact. Following those reports, the S&P 500 and Nasdaq set new closing highs on Wednesday.
Thursday’s July PPI (+0.9% m/m; +3.3% y/y) lifted Treasury yields by ~5 bps and tempered rate‑cut euphoria. However, the S&P still eked out another closing high. However, on Friday, it was a mixed tape. The Dow briefly hit a record intraday high, powered by United Healthcare (UNH), which had a massive surge following news that Berkshire Hathaway took a stake in the beleaguered company. Meanwhile, the S&P and Nasdaq slipped as investors digested July retail sales (+0.5% m/m; ex‑autos +0.3%), July industrial production (‑0.1% m/m; manufacturing flat), and a drop in preliminary August Michigan sentiment to 58.6. That data continues to confirm an overall weakening of the consumption economy, potentially putting pressure on overly optimistic earnings expectations.
Net‑net, the week reinforced a “two‑handed” macro-economic environment. Consumer spending remains resilient, and index levels are elevated. However, upstream price pressures and softer sentiment argue for tactical discipline near highs. Meanwhile, the Treasury bond yield curve continued to re‑steepen (2s/30s near the steepest in ~3 years). Such signals the market’s pivot toward an eventual easing path even as near‑term inflation noise persists.
For investors, there are a few things to be cautious of. First, inflation re-accelerated on the production side, while consumer‑level inflation remains tame, which suggests an increased risk in corporate margins. Such could be particularly noticeable in cyclical stocks if pricing power wanes. Secondly, quality balance sheets, cash flow visibility, and liquidity in portfolios remain a clear advantage. Avoid chasing strength at index highs. Instead, consider leaning into a measured participation. Let the data pull you into or out of risk rather than headlines.
Speaking of portfolio tactics, let’s review the technical backdrop of the market.
📈Technical Backdrop
On Friday, the S&P 500 settled at 6,449.80, pulling back slightly from its all-time closing high on Thursday. While the market rally faded at the end of the week, the overall bullish momentum remains firmly intact. From a technical perspective, the trend remains upward, but there are signs of weakness below the surface. A negative divergence is developing between the rising market and weakening relative strength. Simultaneously, money flows remain weak despite the higher stock grind over the last week. This does not mean the market is about to crash. It suggests that investors should deploy some form of risk management.
(Click on image to enlarge)
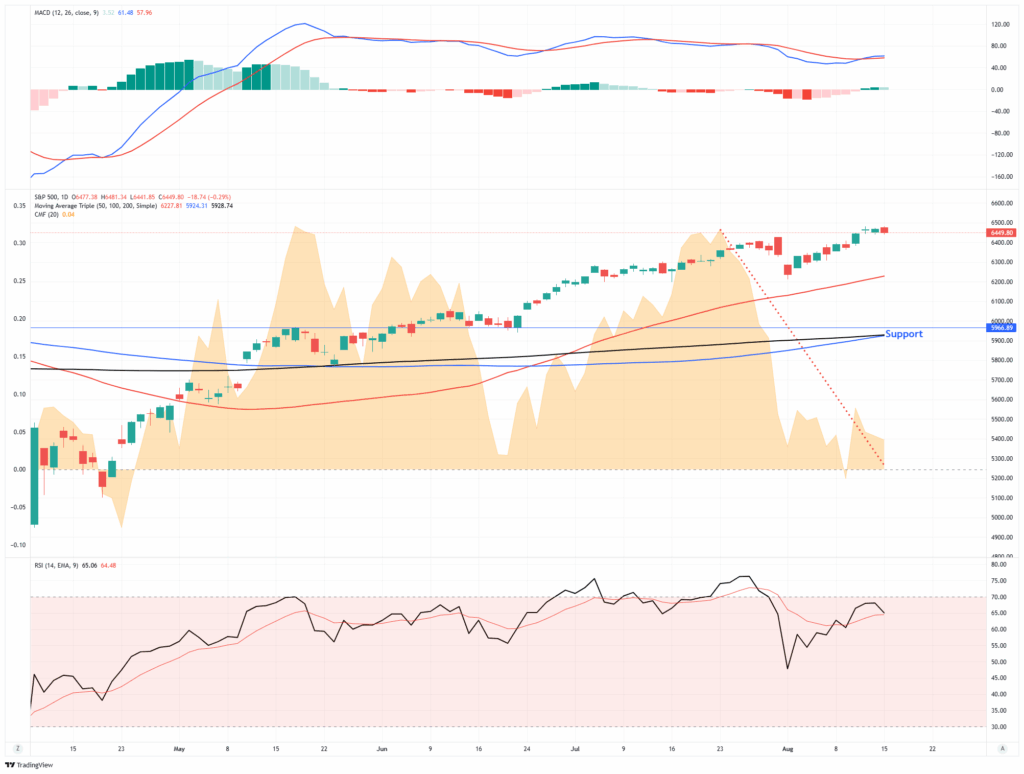
This past week, Goldman Sachs discussed its view of an uptick in downside risk, citing a growing probability of a 10–20% correction in the next three to twelve months. That warning reflects the current market asymmetry, where stretched valuations may limit the upside, but the downside risk is being underestimated. It’s a classic late-stage bull market dynamic: strong momentum cloaking rising fragility.
Valuation red flags are also flashing. According to Bank of America, the S&P 500’s price-to-book ratio has surpassed 5.3, a level not seen even during the dot-com bubble. Combined with a deeply compressed VIX and low equity risk premiums, this suggests a market becoming increasingly complacent. However, it is crucial to remember that valuations ONLY reflect investor sentiment in the very short term. As shown, that sentiment is very bullish.

Still, there are arguments for higher levels. Some traders see the 6,500 level not as a ceiling, but as a launchpad, with hedge funds still underweight and volatility-controlled strategies steadily adding equity exposure.
Bottom line: Investors should remain tactically bullish, but disciplined. The index is technically overbought, breadth remains narrow, and sentiment is beginning to crowd into a handful of trades. Use strength to rebalance, trim excess exposure, and maintain hedges. If the rally broadens and internals improve, there will be plenty of opportunity to add risk. But right now, managing what you own is more important than chasing what you missed.
🔑 Key Catalysts Next Week
With markets still hovering near record highs, the coming week’s data will test whether momentum can continue into late summer. Housing indicators, Fed communications, and preliminary August activity readings will all shape rate-cut expectations and investor positioning.
(Click on image to enlarge)

Overall Risk Outlook: Neutral
While the July CPI data reassured markets that consumer inflation is moderating, the hotter-than-expected PPI reading highlights that upstream cost pressures are still working through the system. Retail sales showed consumers remain willing to spend, but industrial production slipped and consumer sentiment weakened, which are early signs that the growth impulse could be cooling. With equities sitting at or near all-time highs, leadership concentrated in large caps, and valuations stretched, the market is more vulnerable to a shift in sentiment if next week’s housing data, Fed minutes, or Powell’s Jackson Hole remarks fail to reinforce the rate-cut narrative.
The Week Ahead
All eyes are on the Fed this week. With a very weak labor report, tepid CPI data, and a surge in PPI, investors are anxious to hear the Fed’s latest thoughts on the economy and how recent data may influence its policy decisions. They will get that opportunity this week as the Jackson Hole Symposium kicks off on Friday. Chairman Powell will open the meeting with his thoughts on Friday. Many other Fed members will offer their opinions on Friday and during the weekend.
Also of note will be the Fed minutes on Wednesday. This will give us a chance to see if other Fed members were close to dissenting and wanting to cut rates. Other than the Fed, economic data will be on the light side. Heading into the week, the Fed Funds futures markets assign a 93% chance of a rate cut in September.
Insider Selling Reveals The Fallacy Of Buyback Theory
For corporations to perform buybacks, they need someone to buy their shares from. So, who is mostly selling their shares?
It’s corporate insiders, of course. Why? Since the turn of the century, changes in compensation structures have made companies heavily dependent on stock-based compensation. Insiders regularly liquidate shares that were “given” to them as part of their overall compensation structure to convert them into actual wealth. As the Financial Times previously penned:
“Corporate executives give several reasons for stock buybacks but none of them has close to the explanatory power of this simple truth: Stock-based instruments make up the majority of their pay and in the short-term buybacks drive up stock prices.”
Furthermore, a report on a study by the Securities & Exchange Commission found the same:
- SEC research found that many corporate executives sell significant amounts of their shares after their companies announce stock buybacks.
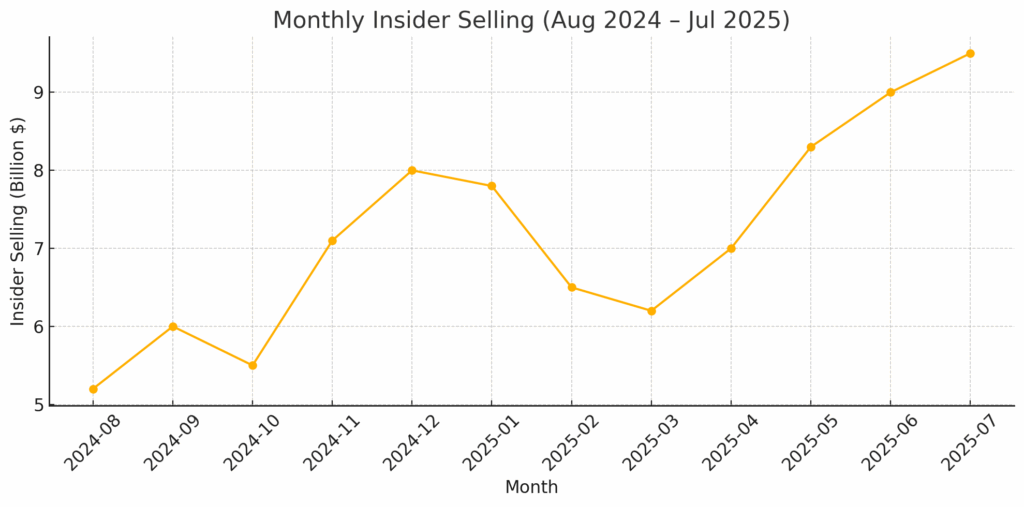
Interestingly enough, the July data also supports that analysis.
In July, insider selling reached its highest level since at least 2018, with only 151 companies reporting insider buying. That means fewer than one-third of firms saw insiders increasing their stakes. If buybacks truly represented a confident return of capital, insiders, the people with the most information, would buy alongside the company. They weren’t.
(Click on image to enlarge)
Tweet of the Day

More By This Author:
Inflation Data Sends Markets To New Highs
Insider Selling Reveals Fallacy Of Buyback Theory
Is Conviction The Biggest Risk To The Stock Market?


Comments
Log in or sign up to join the conversation.