

Image Source: Unsplash
Edward Harrison of Bloomberg recently made the following important market observation: “buying stuff you don’t believe in creates downside risk.” Conviction is a measure of how much investors believe in their holdings. When conviction runs high, investors are often more willing to tolerate lower prices. In fact, some may add to their positions at lower prices. Conversely, when conviction is low, investors are likely to sell at the first sign of trouble. This is the risk Harrison is referring to.
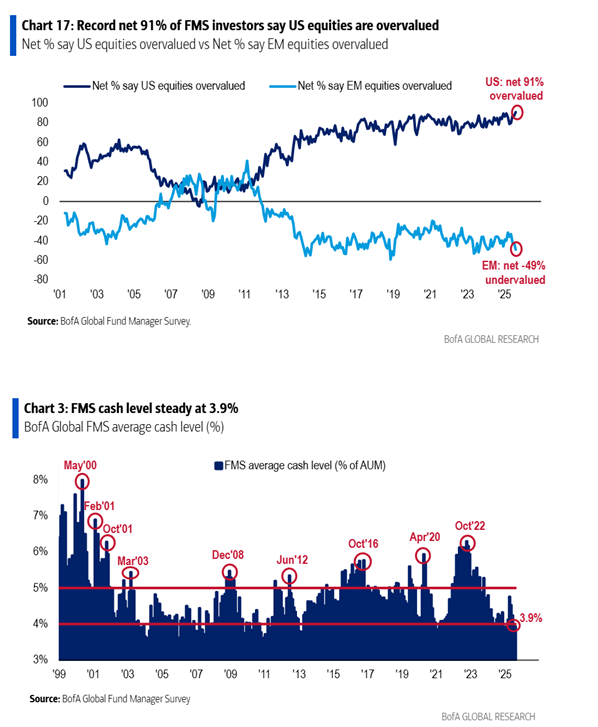
The graphs below help quantify the current state of conviction and risk-taking among fund managers. The first graph shows that a record 91% of fund managers believe the US equity markets are overvalued. Yet, despite their valuation stance, they are nearly fully invested as judged by the near record-low cash balances in the second graph. More simply, institutional fund managers are fully invested but lacking conviction.
Harrison claims the potential market tumult from a lack of conviction was on full display during the sudden market downdraft in early April after the tariff announcement.
This episode shows the vulnerability. Any unexpected policy action or event that could precipitate a US recession will shock investors.
While fund managers may lack conviction and have their fingers on the sell trigger, retail buyers seem to have plenty of conviction. Their buying led the sharp V-shaped recovery from the April lows. Traditionally, Wall Street is considered the “smart money” and Main Street the “dumb money.” Is that still true, or are we in a new market paradigm?
What To Watch Today
Earnings
- No notable earnings releases today
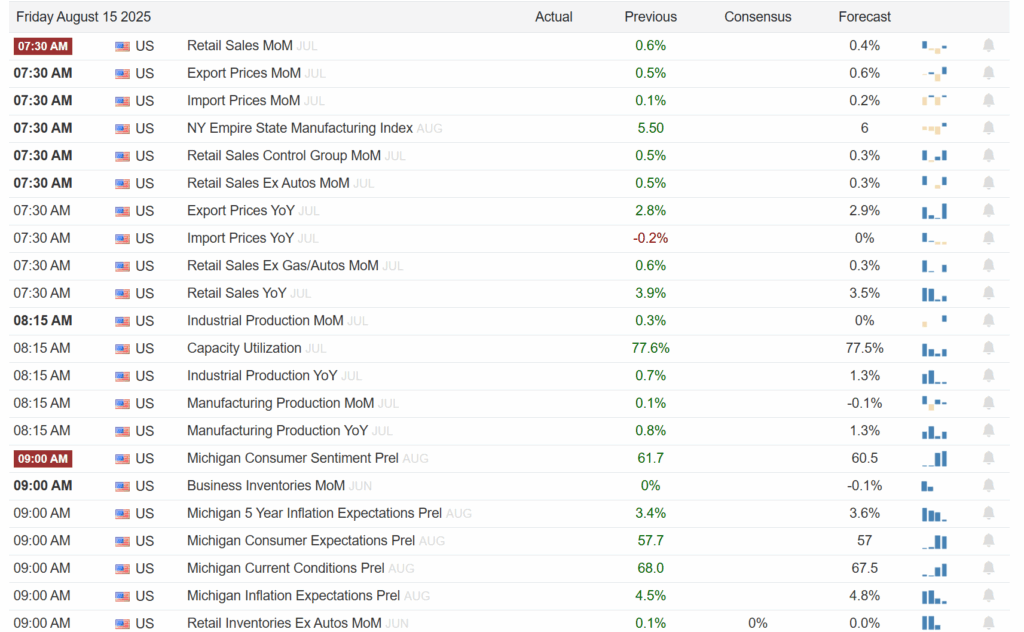
Economy
(Click on image to enlarge)
Market Trading Update
As discussed yesterday, market breadth, while improving over the last few days, has been relatively weak. However, watching the surge in more speculative assets like Bitcoin has been interesting, as it has been an excellent proxy of “risk on” investing strategies. As TopDown Charts noted yesterday morning:
“And here’s the thing, even if you don’t follow Bitcoin/crypto, and have no intention to ever touch it, the fact is by this point it’s probably going to touch you either way — in other words, as a barometer of risk appetite and speculation, as a risk asset itself, and being closely correlated with tech stocks: if Bitcoin goes, tech probably goes too (and the rest of the stockmarket for that matter!).”
So it’s an interesting chart with interesting implications for investors…
(Click on image to enlarge)
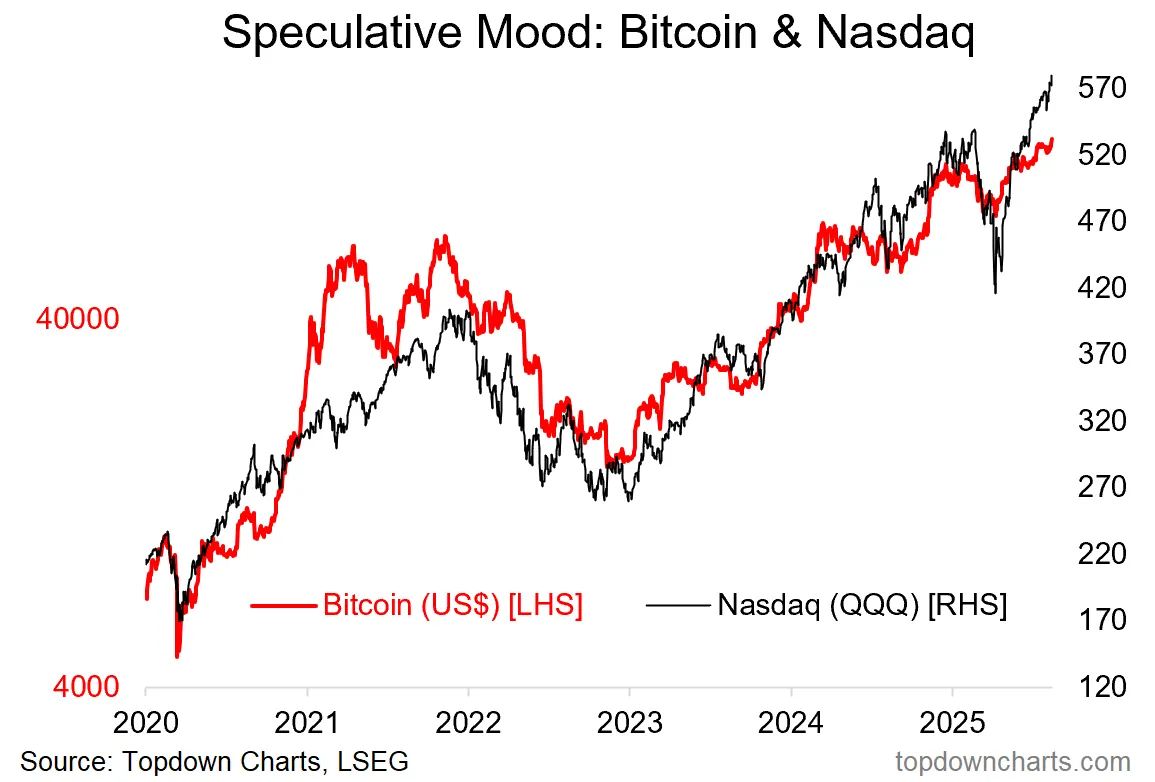
As he notes, and shows below, the correlation between Bitcoin and Nasdaq is more than just casual.
(Click on image to enlarge)
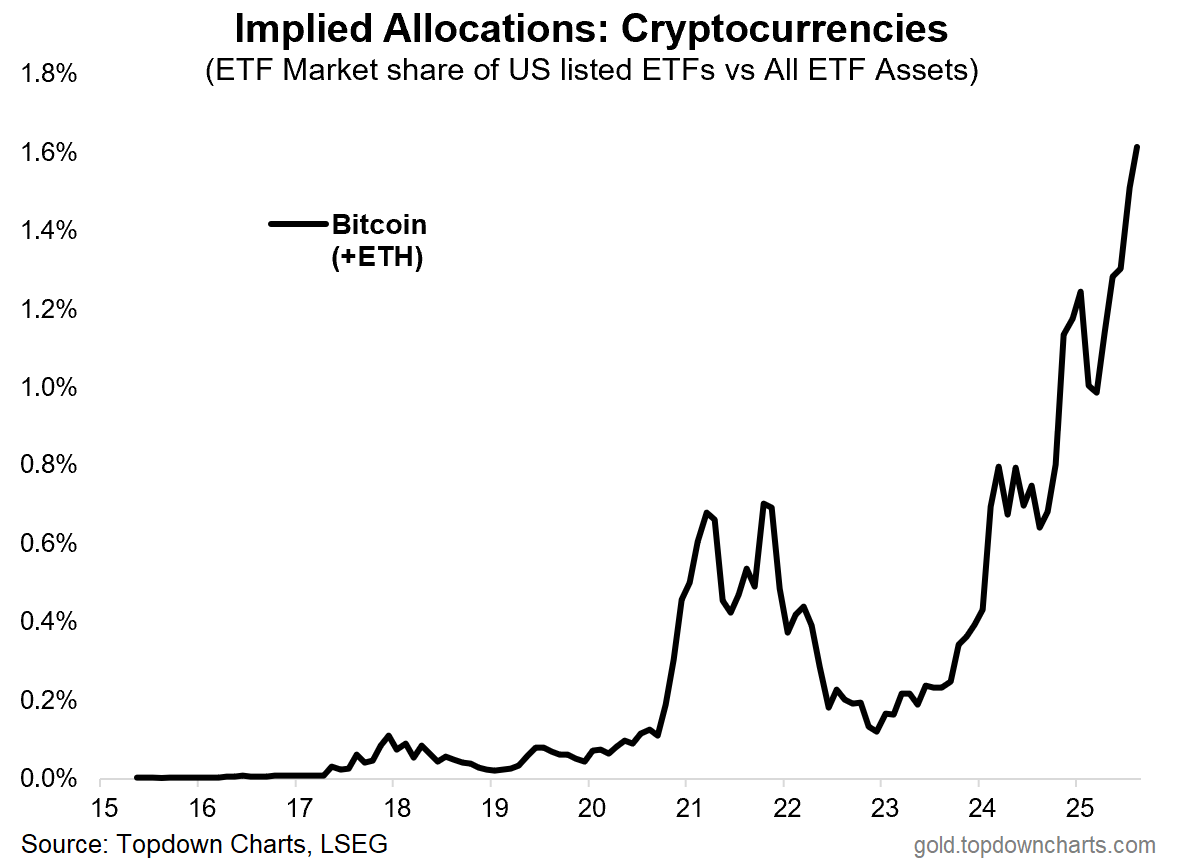
However, while the hope is that crypto will be mass-adopted in portfolios, that is likely only the case if the price of crypto keeps rising. As shown in the chart below, during the price decline in 2022, the anticipated allocations to crypto also declined.

The point here is that while the chase for crypto is very exciting, and hopes are that “Bitcoin will go to 1 million,” there is a substantial risk that if the market, or more importantly, investor sentiment takes a turn in general, that the losses will be quite substantial.
As is always the case, risk management remains key, and diversification of risk will continue to play an important role.
Services Inflation Leads PPI Well Above Estimates
Following the tame CPI report, PPI stunned investors, rising 0.9% for July versus estimates of +0.3%. The stock and bond markets were surprisingly relatively little changed, and the odds of a September rate cut remained over 90%. The culprit for the sharp increase, as we share below, was services. Final demand for goods, excluding food and energy, was +0.4%, not that different from the 0.3% average over the last 6 months.
Accounting for a third of the services category is trade services. This is a proxy for retailer and wholesaler profit margins. It tends to be a volatile statistic. BLS imputed margins can change substantially for relatively minor but divergent changes in selling and acquisition prices. Consider a supermarket that sells water for $1 a bottle and acquires it for 90 cents, resulting in a margin of 10 cents. Now they increase the sale price by a penny to $1.01, representing a 1% increase. However, the margin would increase from 10 cents to 11 cents, a 10% increase. The point is that trade services are volatile, as we share in the second graph. It appears the market appreciates the flaws in its calculation and the extreme volatility of the data point and, for the time being, is choosing to ignore it.
(Click on image to enlarge)


The Hidden Cost Of Not Having An Investment Policy Statement
When it comes to managing wealth, especially for high-net-worth families and business owners, investment decisions can feel overwhelming. Market volatility, emotional reactions, and competing priorities can quickly lead to inconsistent choices that erode long-term success.
That’s where an Investment Policy Statement (IPS) comes in. Yet despite its value, many investors skip this crucial document, unknowingly putting their financial future at risk.
In this article, we’ll explore the investment policy statement importance, outline why it matters for wealthy investors, and offer actionable tips for creating a framework that guides your portfolio with purpose.
Tweet of the Day

More By This Author:
CVs Signal Maturity In Private EquityIs Bad Breadth The Norm, Not The Exception?
A 50 BPS Rate Cut Is Not Out Of The Question


Comments
Log in or sign up to join the conversation.