
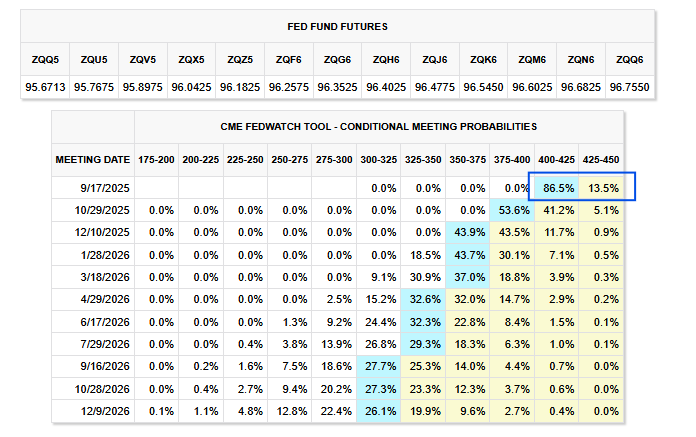
As we share below, the Fed Funds futures market is 86.5% confident the Fed will cut rates by 25 bps in September. However, they assign a zero percent chance that the Fed cuts by 50 bps. Powell’s trepidation to cut rates leaves traders unwilling to consider that anything more than 25bps is possible. We argue that despite the odds, a 50-bps rate cut is possible if today’s CPI report is weak.
CPI is expected to increase by 0.2% on a headline and core basis. A 0.2% increase would bring the year-over-year rate to 2.7%, decently above the Fed’s 2.0% target. Even if CPI were to surprise with a 0% change, the year-over-year change would sit above the Fed’s target. Such is the market’s logic for not considering 50 bps. We think that a student shift lower in inflation, especially as tariffs are having a significant impact, coupled with the recent sharp negative revisions in employment data and new highs in continuing jobless claims, could be enough for the Fed to debate 50 bps.
Moreover, Stephen Miran may likely join the Fed by the September meeting, giving them at least three votes for a cut. Consider also that the two Fed members who voted for a rate cut at the last meeting may think they are already 25 bps behind the curve and want to vote for 50 bps to catch up. The political pressure is on Powell. While he may not cave and vote for 50 bps in September, we think the market is underestimating the odds that a majority of members will. With zero odds, the market is vulnerable (up or down) for a sudden shift in the Fed’s rate projections.
What To Watch Today
Earnings
(Click on image to enlarge)
![]()
Economy
(Click on image to enlarge)

Market Trading Update
Yesterday, we discussed that breadth remained weak despite the market near all-time highs. To wit:
“As noted, momentum signals have softened, the relative strength Index has rolled down from overbought territory and bounced off the neutral 50 level, and money flows are slowing. These signals suggest short-term risk to the bullish narrative until improvement is evident. Market breadth has also narrowed, as shown, with fewer than 60% of S&P 500 stocks above their 50 and 200-day moving averages, highlighting the reliance on mega-cap technology to prop up index levels.”

We concluded that while the uptrend remains intact, weakening breadth, fading momentum, and elevated volatility warrant a more selective approach. A decisive break below 6,150 would tilt the outlook bearish, while stabilization above that level could quickly restore the bull trend. Not only has breadth and momentum softened, but money flows have also deteriorated, suggesting the buying support is running on vapors.
Sentimentrader.com also made a similar, but rather stunning observation.
“Stick around for a little while in this business, and you’ll see something you’ve never seen before. Stick around longer, and you’ll see something nobody has seen before. Like now. For the first time since its inception, the Nasdaq 100 (NDX) closed at a record high with less than 48% of its members trading above their 50-day moving average. Over the past 40 years, an average of 76% of the index members were above their 50-day average when the NDX reached a new high.”

“The distribution of readings shows just how isolated last week’s readings were compared to all other days when the index closed at a record high. Out of 751 days when the NDX set a record, only 6 days recorded less than 50% of members above their 50-day average. Two of those days occurred at the end of last week.”

As I said, that is quite stunning. But such has been the case for a while, as market concentration continues to climb. As we discussed in the linked article below, while the market continues to rise toward new highs, the deeper structural story is the concentration of market gains in a few mega-cap stocks due to passive index flows.

However, like an iceberg where we only witness the 10% rising above the water, the passive index concentration hides underlying weakness. Equal-weight versions of the S&P 500, which give each stock the same importance, are underperforming. That shows that the broader market is struggling outside of the top names. When gains are so concentrated, the market’s foundation is narrower than it appears.

To better understand that performance gap, it is currently the largest since the “Financial Crisis.”
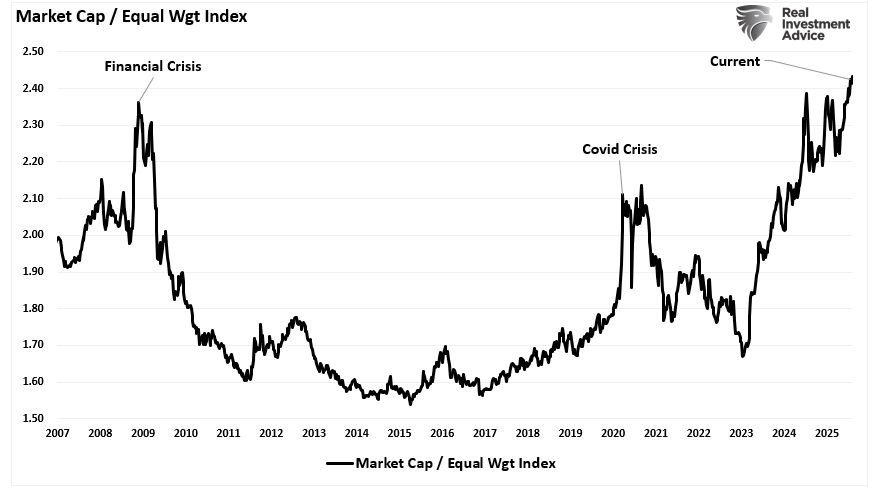
While I am not saying we are about to enter the next “financial crisis,” the market’s actions are clearly not healthy. Risk management remains a high priority while still participating in this bull market.
Apple And Technology Lead The Market Higher; Everything Else Lags
On a relative basis, the technology sector is the clear leader. As shown below, it is moderately overbought versus the market on a relative basis. Importantly, every other sector is near fair value or oversold versus the market. Apple, rising by over 12% last week versus the 2% for the S&P 500, helped push the technology sector up and to the right, indicating overbought conditions on a relative and absolute basis. As the graph shows, there is a clump of sectors at fair value, and another that are getting very oversold. Of the very oversold, healthcare weakened by sharp declines in UNH and LLY are now grossly oversold versus the market. The analysis argues that any shift in market tenor could see healthcare outperform and technology underperform.
(Click on image to enlarge)

Meme Stock Trading & Livermore’s Approach To Speculation
So, how do you navigate a “meme stock trading” market and “live to tell about it?”
Jesse Livermore’s approach in 1916 remains relevant in an era defined by meme stock trading, speculative retail trading, and extreme passive index concentration. Livermore understood that the market is rarely rational in the short term. Prices can extend beyond fundamental value when driven by sentiment, liquidity, or herd behavior. His method was not about predicting tops or bottoms but identifying when the market’s internal strength was shifting.
Livermore stayed long when the leaders, the strongest stocks, continued to rise. However, he watched for early cracks, like when those leaders began underperforming the broader market or when volume patterns signaled distribution rather than accumulation. When leadership broke down, he reduced exposure gradually, moving from aggressive long positions to a balanced stance, and only then to outright bearish trades when weakness spread across the board.
What is crucial about risk management is that in speculative phases, timing is not about guessing the exact turning point. It is about recognizing when the odds have shifted. Today, that means paying close attention to mega-cap stocks that dominate passive index flows and monitoring speculative hot spots like meme stocks, small caps, and high-beta sectors.
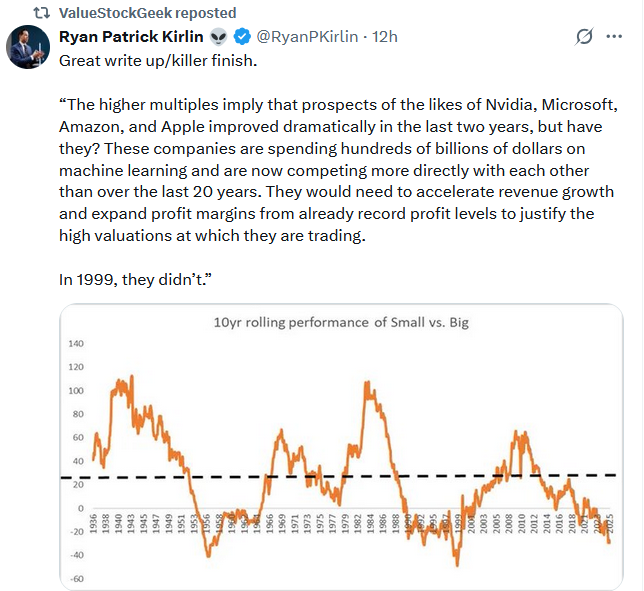
Tweet of the Day
More By This Author:
Meme Stock Trading & Livermore’s Approach To SpeculationAuto Manufacturing Shift Puts Pressure On Profits
U.S. Economic Growth Shows Cracks


Comments
Log in or sign up to join the conversation.