

Image Source: Pixabay
Since the bullish momentum bar reacted to the CPI on 10 Nov 2022, S&P 500 has been trending up without threatening price action and excessive supply. Despite the long-term direction still down together with the gloomy macro, the price action, and the volume still suggest the least resistance path is up based on the Wyckoff trading method.
Watch the video below to find out where could this bear market rally peak and what to expect next for a bearish scenario and at what point could it be violated.
Video Length: 00:09:19
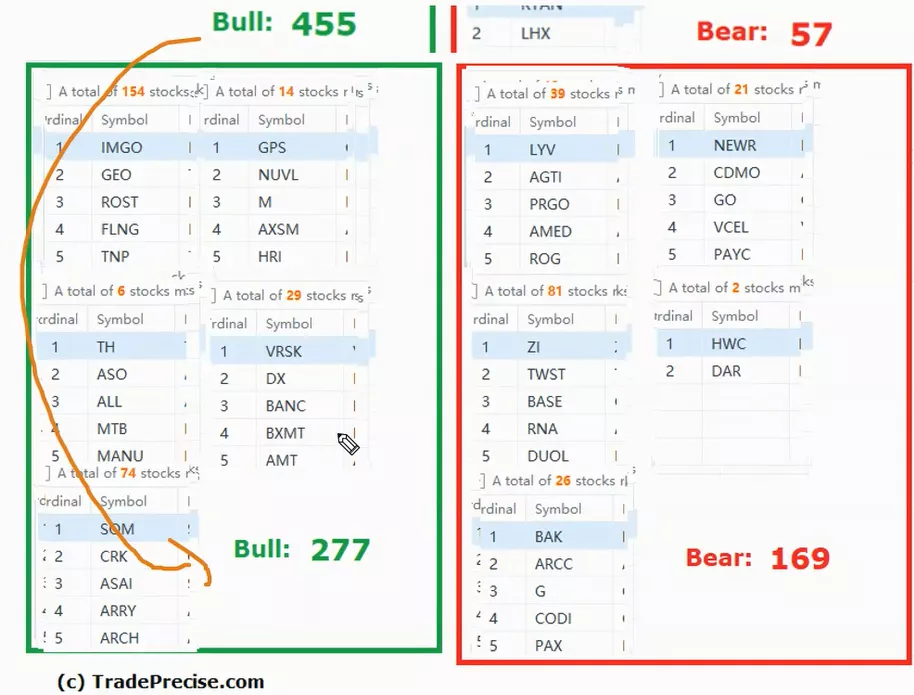
The bullish setup vs. the bearish setup is 277 to 169 from the screenshot of my stock screener below.
If you are a long-term investor and waiting to spot a stock market bottom, there is likely more work to be done as shown in the market structure. Yet, there are more than enough outperforming stocks with low-risk entries when you know how to identify the winning stocks for swing trading. The key is to be nimble with conservative trade management.
More By This Author:
Bear Market Rally Or Stock Market Bottom? Form Your Trading Plan With Wyckoff Method
A Trading Plan Of Reversal Trading For S&P 500 At This Axis Area
Is JPMorgan Chase Spared From The Bear?


Comments
Log in or sign up to join the conversation.