

Image Source: Unsplash
After an impulsive down wave in S&P 500 after the FOMC rate hike, it is still testing the key area with possible more weakness ahead to be triggered by the coming CPI announcement.
Watch the video below to find out how you can take advantage of a simple trading plan to trade the reversal in S&P 500 at the key area with multiple timeframe analysis using the Wyckoff method.
Video Length: 00:10:58
The bullish setup vs. the bearish setup is 493 to 130 from the screenshot of my stock screener below.
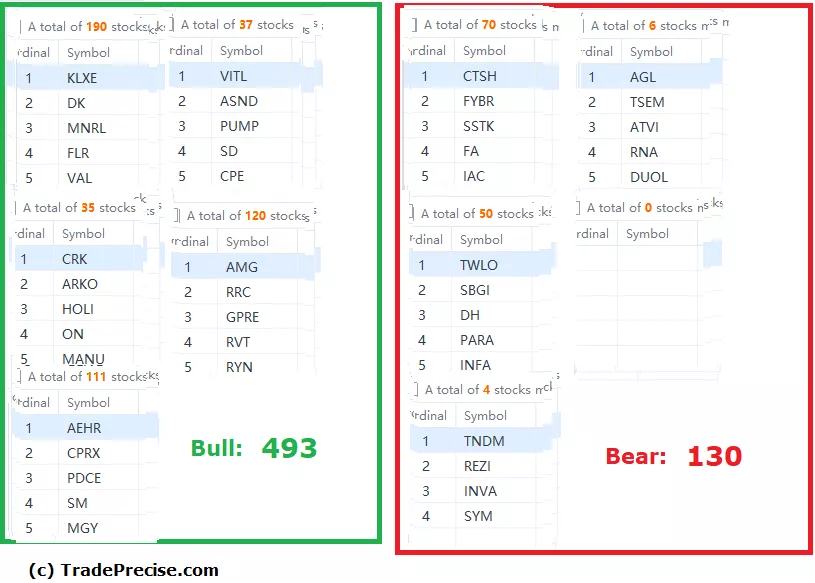
There is certainly smart money rotation from the Nasdaq into the Dow Jones, which is a typical sector rotation from growth into the value theme. There are many mega cap stocks hitting new highs while some high reward-to-risk trade entry setup. These are still the outperforming stocks since the low formed in October and should be the ones to focus on when you are looking to find the winning stocks for swing trading.
More By This Author:
Is JPMorgan Chase Spared From The Bear?
Will Merck Continue Its Bullish Streak? A Wyckoff Analysis
Would Boeing Continue To Soar Or Crash?


Comments
Log in or sign up to join the conversation.