
U.S. Stocks - JPMorgan Chase & Co.
JP Morgan & Chase Co. (JPM) – Elliott Wave Analysis
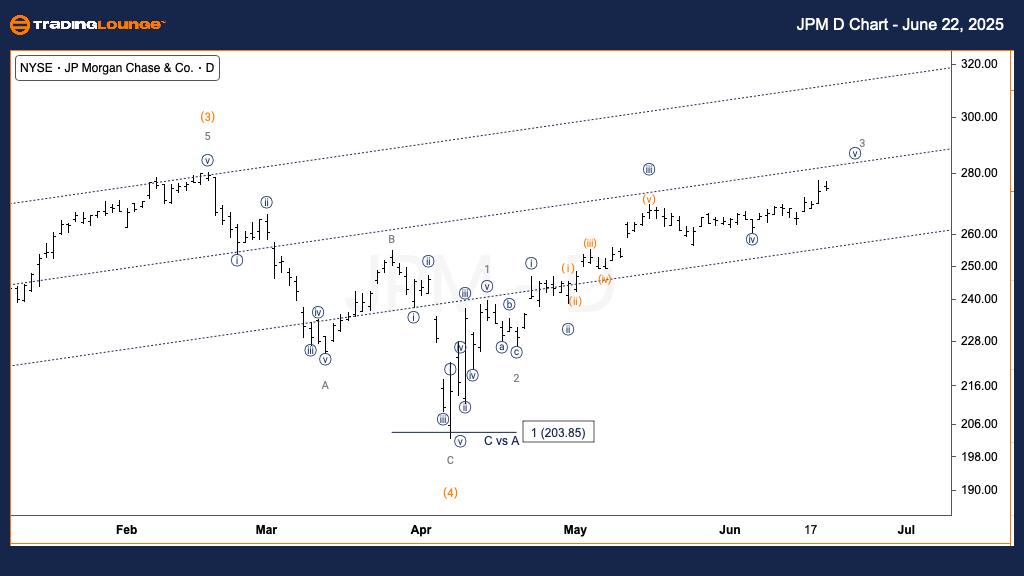
Daily Chart
FUNCTION: Trend
MODE: Impulsive
STRUCTURE: Motive
POSITION: Wave {v} of 3
DIRECTION: Upward in wave {v}
DETAILS: JPM is currently moving within MinorGroup2, near $265, with a potential rise toward $280. This likely marks the final phase of wave {v} of 3 before a correction phase begins.
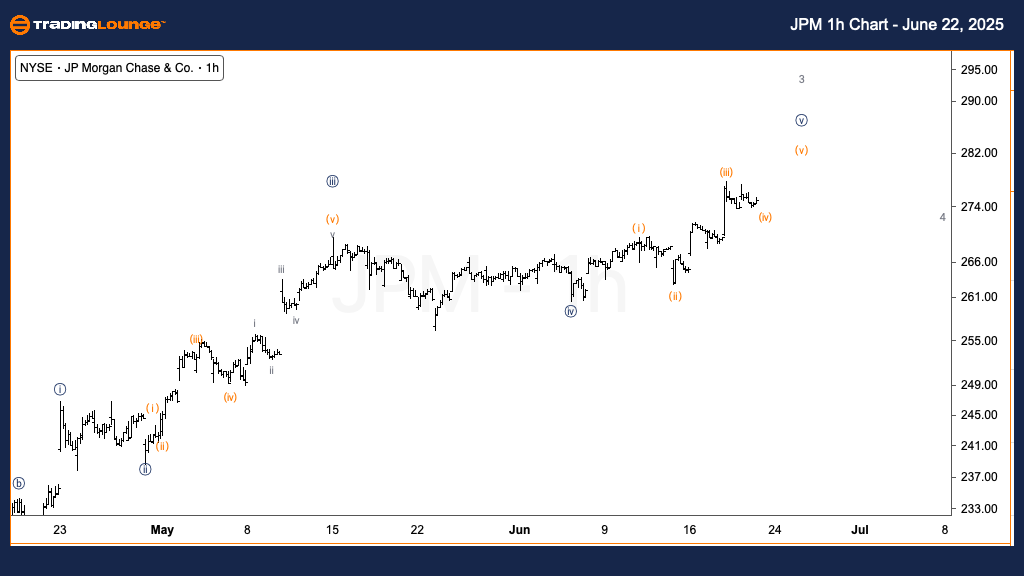
1-Hour Chart
FUNCTION: Trend
MODE: Impulsive
STRUCTURE: Motive
POSITION: Wave (iv) of {v}
DIRECTION: Upward in wave (v)
DETAILS: On the shorter time frame, JPM is forming wave (iv) of {v}, indicating at least one more leg higher into wave (v). This would complete the minor 5-wave sequence and align with the daily outlook.
Technical Analyst: Alessio Barretta
More By This Author:
Elliott Wave Technical Analysis - Russell 2000
Elliott Wave Technical Analysis: U.S. Dollar/Swiss Franc - Monday, June 23
Indian Stocks - Axis Bank
At TradingLounge™, we provide actionable Elliott Wave analysis across over 200 markets. Access live chat rooms, advanced AI & algorithmic charting tools, and curated trade ...
more

