
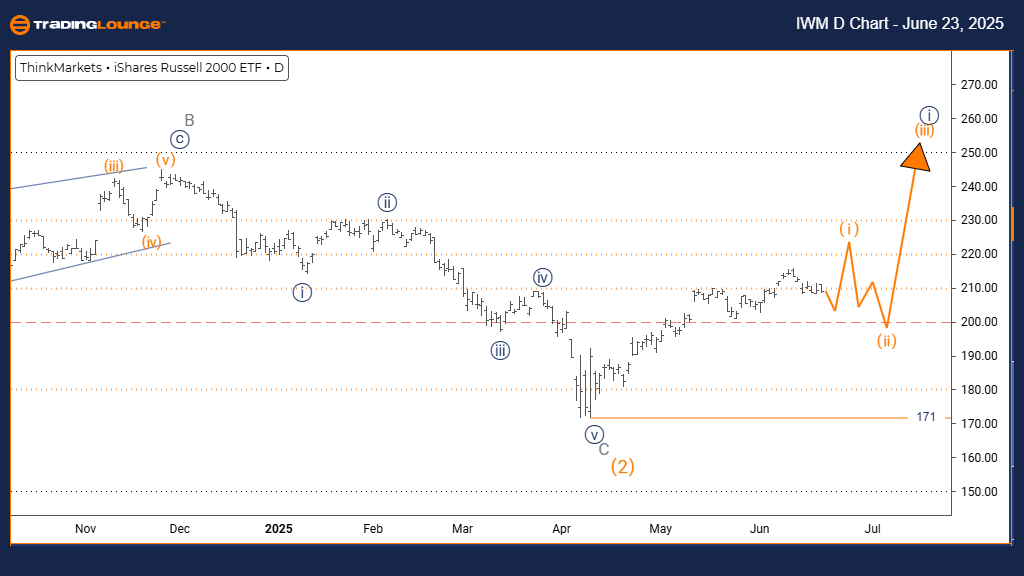
RUSSELL 2000 Elliott Wave Analysis – Trading Lounge Daily Chart
RUSSELL 2000 Elliott Wave Technical Analysis
FUNCTION: Bullish Trend
MODE: Impulsive
STRUCTURE: Orange Wave 1
POSITION: Navy Blue Wave 1
DIRECTION NEXT LOWER DEGREES: Orange Wave 2
DETAILS: Orange Wave 1 of Navy Blue Wave 1 is active as part of a new uptrend
CANCEL INVALIDATION LEVEL: 171
The RUSSELL 2000 daily chart indicates a bullish trend under Elliott Wave analysis. The price is currently in an impulsive phase, suggesting strong upward momentum. The active structure is Orange Wave 1, which is developing as a component of Navy Blue Wave 1. This placement implies the index is at the start of a larger upward movement.
Orange Wave 1 marks the beginning of a potential new trend within Navy Blue Wave 1. This phase is typically associated with strong price movement driven by renewed buying interest. Once Orange Wave 1 concludes, Orange Wave 2 is expected to initiate, representing a temporary correction.
The critical invalidation level is set at 171. A drop below this threshold would invalidate the current wave count and necessitate reevaluation. As long as the index holds above this level, the bullish wave structure remains intact.
The technical view supports the expectation of a continued upward move for RUSSELL 2000, with Orange Wave 1 in progress. The impulsive structure signals firm bullish pressure and a likelihood of additional gains.
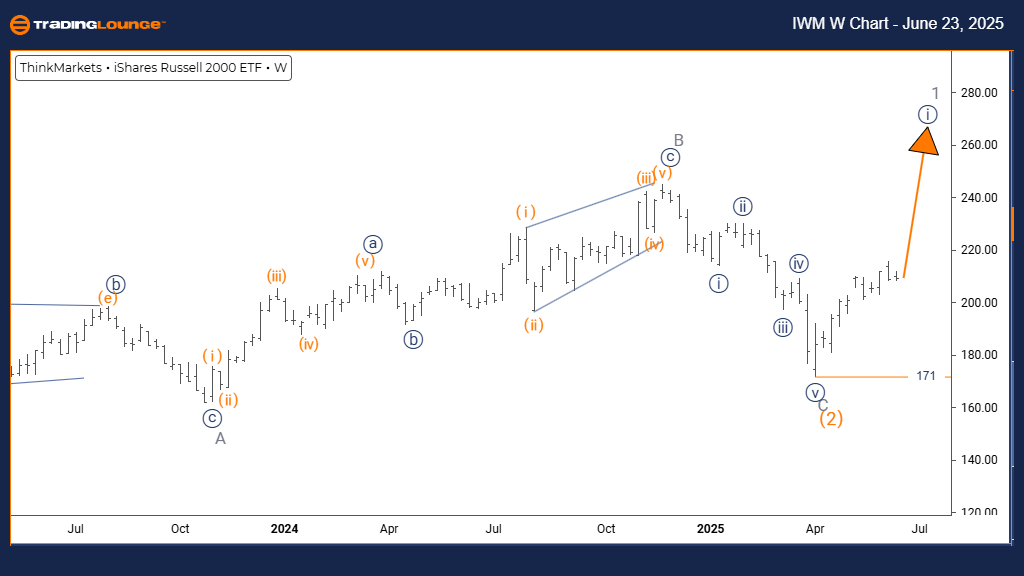
RUSSELL 2000 Elliott Wave Analysis – Trading Lounge Weekly Chart
RUSSELL 2000 Elliott Wave Technical Analysis
FUNCTION: Bullish Trend
MODE: Impulsive
STRUCTURE: Navy Blue Wave 1
POSITION: Gray Wave 1
DIRECTION NEXT LOWER DEGREES: Navy Blue Wave 2
DETAILS: Navy Blue Wave 1 of Gray Wave 1 is active as part of a new uptrend
CANCEL INVALIDATION LEVEL: 171
The RUSSELL 2000 weekly chart analysis shows a bullish outlook under Elliott Wave principles. The index is moving in an impulsive wave structure, signaling strong positive momentum. The wave identified as Navy Blue Wave 1 is unfolding within Gray Wave 1, suggesting the index is at the beginning of a potentially major upward trend.
This wave formation represents the initial stage of Gray Wave 1. Navy Blue Wave 1 typically introduces a new bullish phase with increasing market activity. After its completion, a corrective Navy Blue Wave 2 is expected to follow.
The crucial level to watch is 171. A decline below this point would invalidate the existing wave structure and call for a fresh technical analysis. Until then, the upward trend remains supported by the wave sequence.
The chart configuration supports the expectation that RUSSELL 2000 may experience extended upward movement. Navy Blue Wave 1’s impulsive behavior indicates strong buying interest, possibly leading to sustained gains in the upcoming periods.
Technical Analyst: Malik Awais
More By This Author:
Elliott Wave Technical Analysis: U.S. Dollar/Swiss Franc - Monday, June 23
Indian Stocks - Axis Bank
Unlocking ASX Trading Success: BHP Group Ltd. Analysis & Technical Forecast


Comments
Log in or sign up to join the conversation.