
AXIS BANK Elliott Wave Analysis – Trading Lounge Daily Chart
AXIS BANK Elliott Wave Technical Analysis
FUNCTION: Bullish Trend
MODE: Impulsive
STRUCTURE: Orange Wave 5
POSITION: Navy Blue Wave 1
DIRECTION NEXT LOWER DEGREES: Navy Blue Wave 2
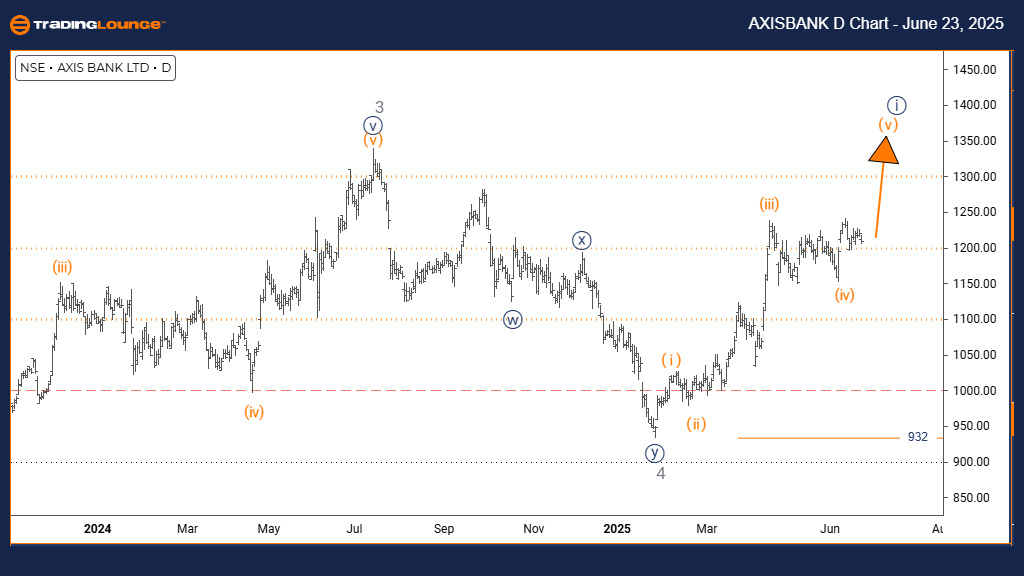
DETAILS: Orange Wave 4 appears completed; Orange Wave 5 is now developing.
CANCEL INVALID LEVEL: 932
The AXIS BANK daily chart shows a bullish trend based on Elliott Wave analysis. The price is moving in an impulsive manner, signaling strong upward momentum. The current wave is labeled as Orange Wave 5, forming part of a larger sequence, specifically Navy Blue Wave 1. This suggests the stock is in the final phase of an upward impulse wave within a broader bullish structure.
Analysis indicates that Orange Wave 4 has completed its corrective phase. Now, Orange Wave 5 is underway, typically the final part of an Elliott Wave impulse pattern. This wave usually comes with strong directional price action. Once Orange Wave 5 finishes, the market is expected to enter Navy Blue Wave 2 – a corrective phase.
A key level to monitor is 932. If the price falls below this level, it would invalidate the current Elliott Wave interpretation and require a reassessment of the bullish outlook. Until this point, the wave pattern supports further upward movement.
The technical outlook indicates AXIS BANK is positioned for the final stage of an upward push with Orange Wave 5 active. The impulsive wave suggests ongoing buying strength. However, traders should be cautious and watch for reversal signs, as this marks the end of Navy Blue Wave 1.
AXIS BANK Elliott Wave Analysis – Trading Lounge Weekly Chart
AXIS BANK Elliott Wave Technical Analysis
FUNCTION: Bullish Trend
MODE: Impulsive
STRUCTURE: Navy Blue Wave 1
POSITION: Gray Wave 5
DIRECTION NEXT LOWER DEGREES: Navy Blue Wave 2
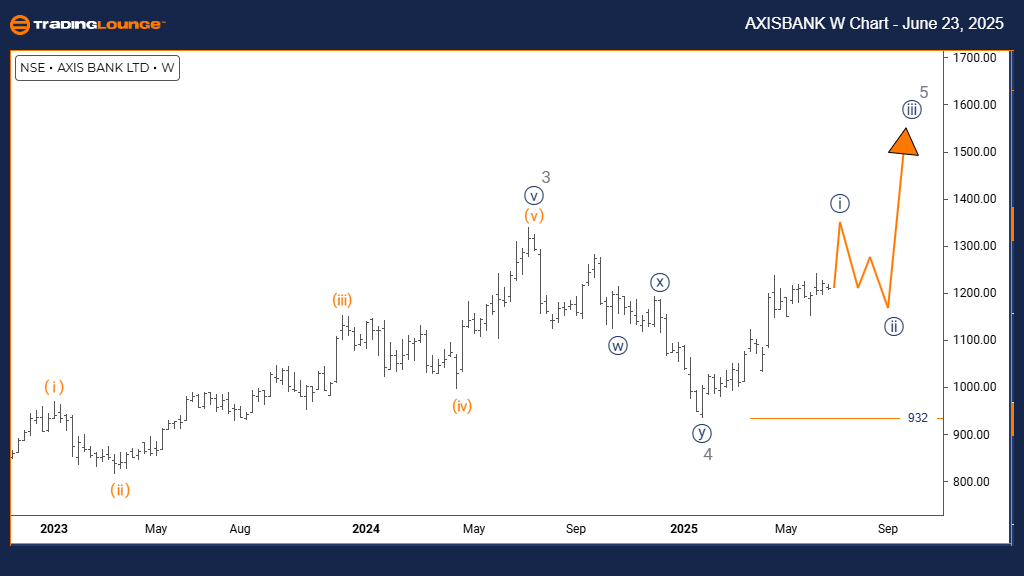
DETAILS: Gray Wave 4 appears completed; Navy Blue Wave 1 of 5 is now in progress.
CANCEL INVALID LEVEL: 932
The AXIS BANK weekly chart reflects a bullish trend through Elliott Wave analysis. The stock is currently in an impulsive phase, signaling strong upward momentum. This wave is labeled as Navy Blue Wave 1, which is part of a broader structure, Gray Wave 5. This position indicates that the stock may be entering the early phase of its final upward wave in the ongoing bullish trend.
Gray Wave 4 has completed its correction, and the transition into Navy Blue Wave 1 of Gray Wave 5 has begun. This initial wave typically shows momentum, often preceding the final segment of an Elliott Wave pattern. Once Navy Blue Wave 1 ends, the next move is expected to be Navy Blue Wave 2, signaling a corrective pullback.
A key level to watch is 932. If the stock drops below this point, it invalidates the current wave structure, necessitating a reassessment. As long as the price stays above this threshold, the bullish outlook remains valid.
The current setup suggests AXIS BANK could see strong upward momentum, as Navy Blue Wave 1 is now underway following the end of Gray Wave 4. The impulsive behavior implies persistent buying strength. However, since this is a first wave within a fifth wave, traders should stay alert for signs indicating trend completion.
Technical Analyst: Malik Awais
More By This Author:
Unlocking ASX Trading Success: BHP Group Ltd. Analysis & Technical Forecast
Elliott Wave Analysis: Nasdaq Tech Stocks & Bitcoin
Elliott Wave Analysis: Bovespa Index


Comments
Log in or sign up to join the conversation.