Elliott Wave Technical Analysis: U.S. Dollar/Swiss Franc - Monday, June 23
USDCHF Elliott Wave Analysis – Trading Lounge
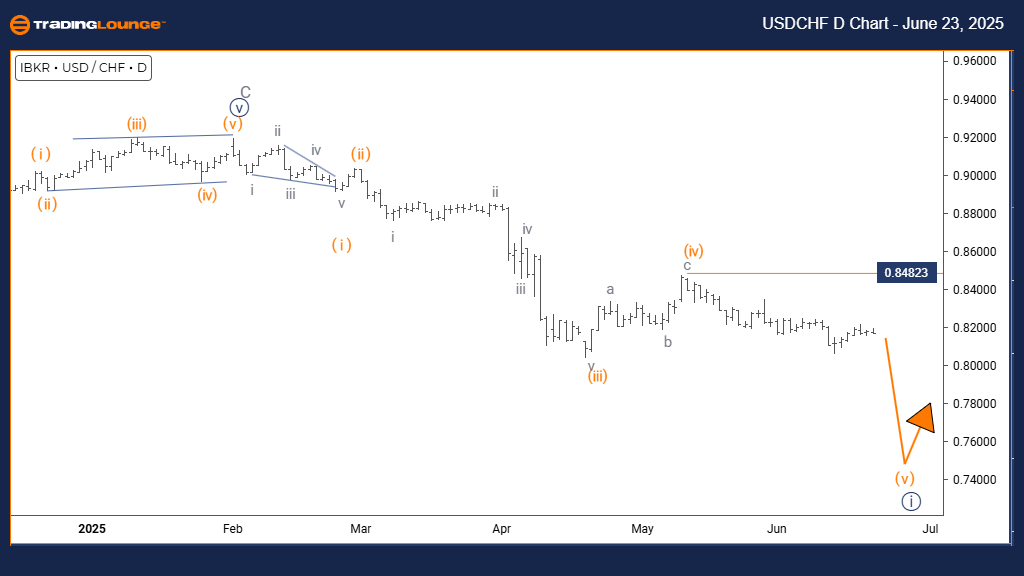
U.S. Dollar / Swiss Franc (USDCHF) Day Chart
USDCHF Elliott Wave Technical Analysis
FUNCTION: Bullish Trend
MODE: Impulsive
STRUCTURE: Navy Blue Wave 1
POSITION: Gray Wave 1
DIRECTION NEXT LOWER DEGREES: Navy Blue Wave 2
DETAILS: Navy Blue Wave 1 of Gray Wave 1 is active
CANCEL INVALID LEVEL: 0.84823
The USDCHF daily Elliott Wave chart analysis shows a bullish trend. The price action is currently in an impulsive phase, indicating strong buying pressure. The active wave is labeled Navy Blue Wave 1, which is part of the larger Gray Wave 1 structure. This suggests the pair is beginning a potential long-term upward movement.
Navy Blue Wave 1 is now progressing inside Gray Wave 1, typically marking the start of a new trend. After completion, Navy Blue Wave 2 is expected to initiate, which will likely be a temporary corrective pullback before the broader trend continues.
The key level to monitor is 0.84823. If the price falls below this level, the current wave interpretation would be invalid, requiring a reassessment of the bullish scenario. As long as this level holds, the wave structure supports further upside potential.
Technically, USDCHF is in position for a likely extended move upward, with Navy Blue Wave 1 gaining strength. The impulsive wave indicates strong market participation and suggests possible gains ahead.

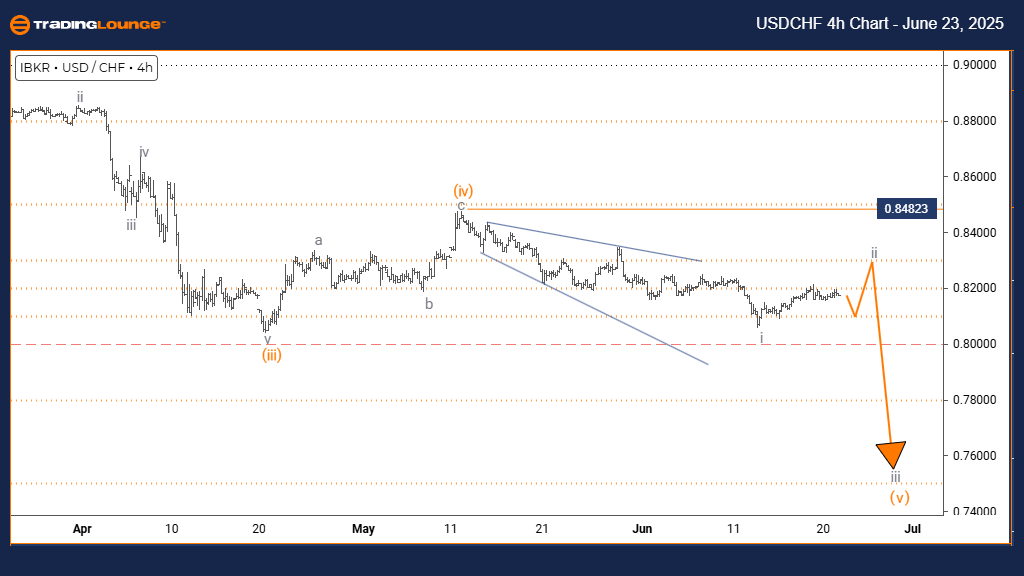
U.S. Dollar / Swiss Franc (USDCHF) 4-Hour Chart
USDCHF Elliott Wave Technical Analysis
FUNCTION: Counter Trend
MODE: Corrective
STRUCTURE: Gray Wave 2
POSITION: Orange Wave 5
DIRECTION NEXT LOWER DEGREES: Gray Wave 3
DETAILS: Gray Wave 1 has completed; Gray Wave 2 is active
CANCEL INVALID LEVEL: 0.84823
The USDCHF 4-hour chart reflects a counter-trend situation with the price in a corrective phase. The active wave, Gray Wave 2, appears as part of a broader movement within Orange Wave 5, indicating a pullback within a larger bullish cycle.
Gray Wave 1 is now complete, transitioning the pair into Gray Wave 2. This phase usually retraces a portion of the previous movement before the dominant trend resumes. After Gray Wave 2 completes, Gray Wave 3 is expected to start, potentially continuing the major trend direction.
The invalidation level is set at 0.84823. If the price dips below this level, the current wave structure will be invalidated and require a new analysis. Until that occurs, the pattern supports a corrective pullback with the potential for upward resumption.
The technical picture suggests range-bound trading or mild pullbacks during Gray Wave 2. Traders should observe for signs of this wave’s completion before entering the next projected upward leg, Gray Wave 3.

Technical Analyst: Malik Awais
More By This Author:
Unlocking ASX Trading Success: BHP Group Ltd. Analysis & Technical Forecast
Elliott Wave Analysis: Nasdaq Tech Stocks & Bitcoin
Elliott Wave Analysis: Bovespa Index
At TradingLounge™, we provide actionable Elliott Wave analysis across over 200 markets. Access live chat rooms, advanced AI & algorithmic charting tools, and curated trade ...
more


