
Another day, another megacap tech winner. Yesterday’s was Microsoft (MSFT), up over 7% yesterday and another 2.5% today. Today’s of course is Meta Platforms (META), up over 14% this morning. Our recent concerns about how the broad indices were over-reliant upon megacap techs have been flipped on their head. Tesla (TSLA), the first of the group to report was a disappointment, and Alphabet (GOOG, GOOGL) was only a modest positive, but the back-to-back successes have been enough to put a positive spin on the market as a whole. Today we will learn if Amazon (AMZN) can turn the recent daily double into a trifecta.
On Tuesday, we noted on that the most active MSFT option was the 300 strike calls expiring tomorrow. That seemed like a bit of a stretch at the time, but the calls are now over $3 in the money. We see something similar in AMZN, with volume of over 30,000 in the 115 calls expiring tomorrow and over 25,000 of the 120 calls trading as well. After the big jumps in MSFT and META, one can’t blame speculators for taking a shot at a similar jump in AMZN.
The 115 level would be about on par with the historical average post-earnings move of 6.71%, while the 120 level seems reachable when one considers that the past five post-earnings moves have been -8.43%, -6.8%, +10.36%, -14.05%, and 13.54%. That said, we are seeing far lower volumes in puts of similar moneyness, so it is clear that speculation is far outweighing hedging at the moment. Bear in mind also that AMZN is up over 6.5% since Tuesday, so a fair amount of optimism may already be priced in.
On a day like today, it would be tempting to paint earnings season as a great success so far. But the broad indices don’t bear that out. It is fair to put the start of earnings season on the 14th, the day that JPMorgan Chase (JPM) and other major banks kicked off the parade. A two-week chart shows that S&P 500 (SPX) and NASDAQ 100 (NDX) were oozing lower until today’s rally:
2 Week Chart, SPX (red/green 5-minute bars), NDX (blue line)
(Click on image to enlarge)
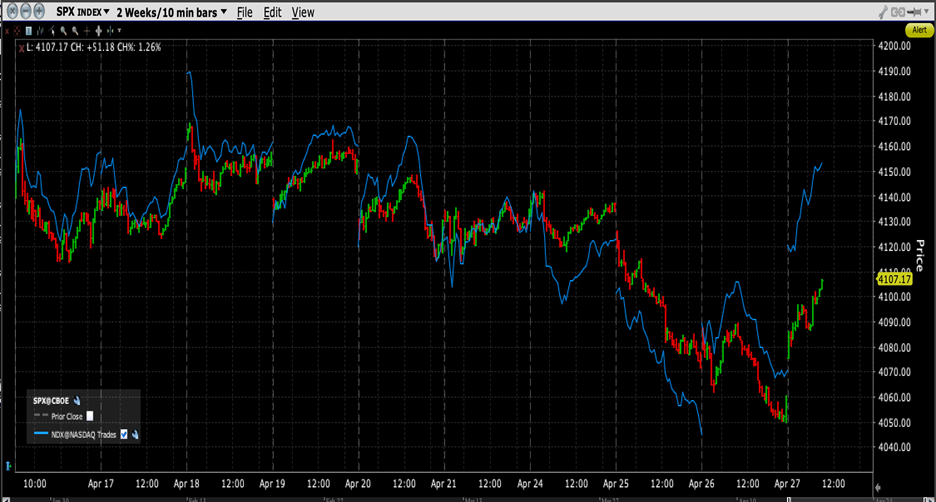
Source: Interactive Brokers
Also, our brief flirtation with increased concerns about future volatility have ebbed. There was some brief concern when SPX had its first down move of over 1% in a month on Tuesday, but the Cboe Volatility Index (VIX) has now reverted to the levels that prevailed earlier this month:
2 Week Chart, VIX (red/green 5-minute bars)
(Click on image to enlarge)
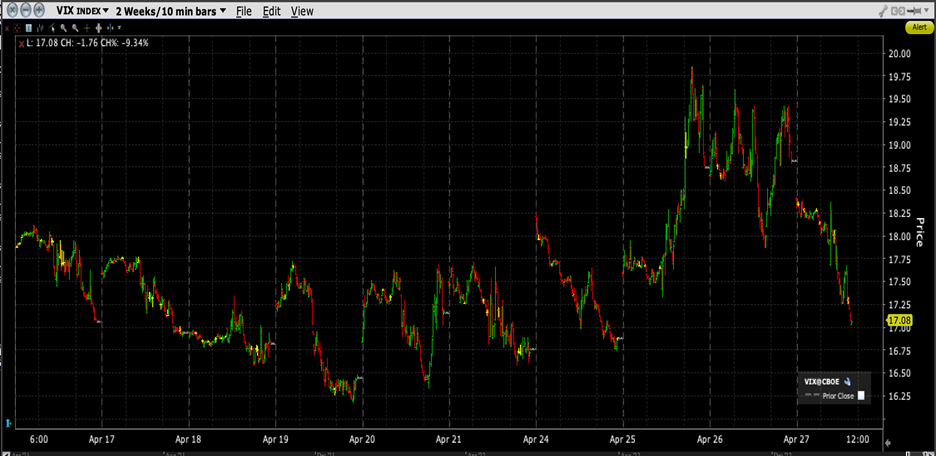
Source: Interactive Brokers
We noted at the time that the low levels of VIX were commensurate with those last seen before some periods when the broad market turned lower. The volatility index is anticipating modest moves over the coming month – one that includes next week’s FOMC meeting, Apple (AAPL) earnings, the April Payrolls report, and an apparent lack of resolution to the impending debt ceiling crisis.
The speculators have control of the narrative for now. They’ve earned it. When high-profile stocks like MSFT, META, and Chipotle Mexican Grill (CMG) soar by double digits, it is quite understandable why traders would take the over on AMZN as well. But one theme of the equity market’s performance to date is the narrow leadership and reliance upon a few selected megacap winners. Whether or not that extends to the megacaps that have yet to report and the economy as a whole remains an open question, even if VIX seemed to indicate that the worries are once again behind us.
More By This Author:
We Love Our Junk Food And Are Willing To Pay Up For It
What The Options Market Is Expecting For Microsoft And Alphabet Earnings
Bed, Bath And The Great Beyond


Comments
Log in or sign up to join the conversation.