

Image Source: Unsplash
Watch the video extracted from the live session on 27 Jun 2023 below to find out the following:
- Current market conditions, specifically the pullback and the support zone to watch for a potential bounce
- 1 outperformance industrial group that stood out during the market pullback.
- Using the volume spread analysis to spot the stopping action with hidden demand.
- The characteristics of a change of character wave for a trend reversal.
- And a lot more
Video Length: 00:07:28
The bullish vs. bearish setup is 282 to 136 from the screenshot of my stock screener below pointing to a positive market environment. Even though the market was pulling back last week, there is still no shortage of bullish trade setups.
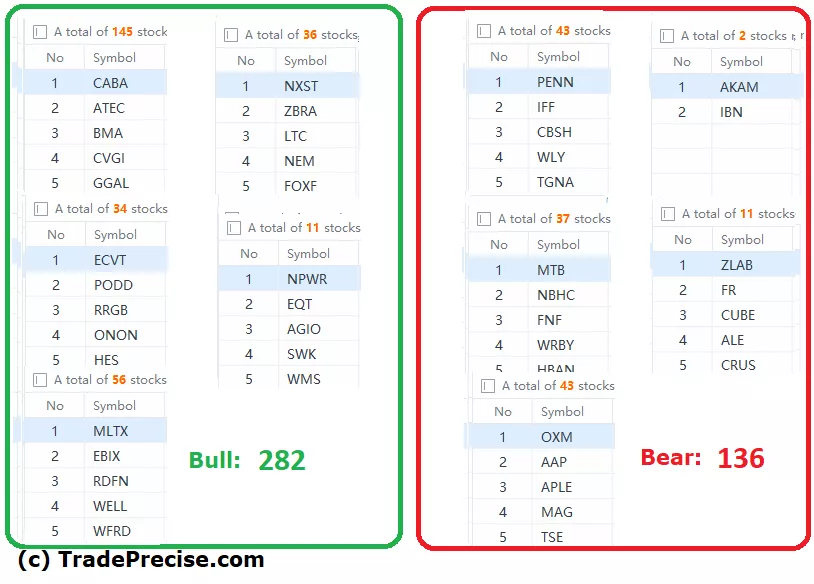
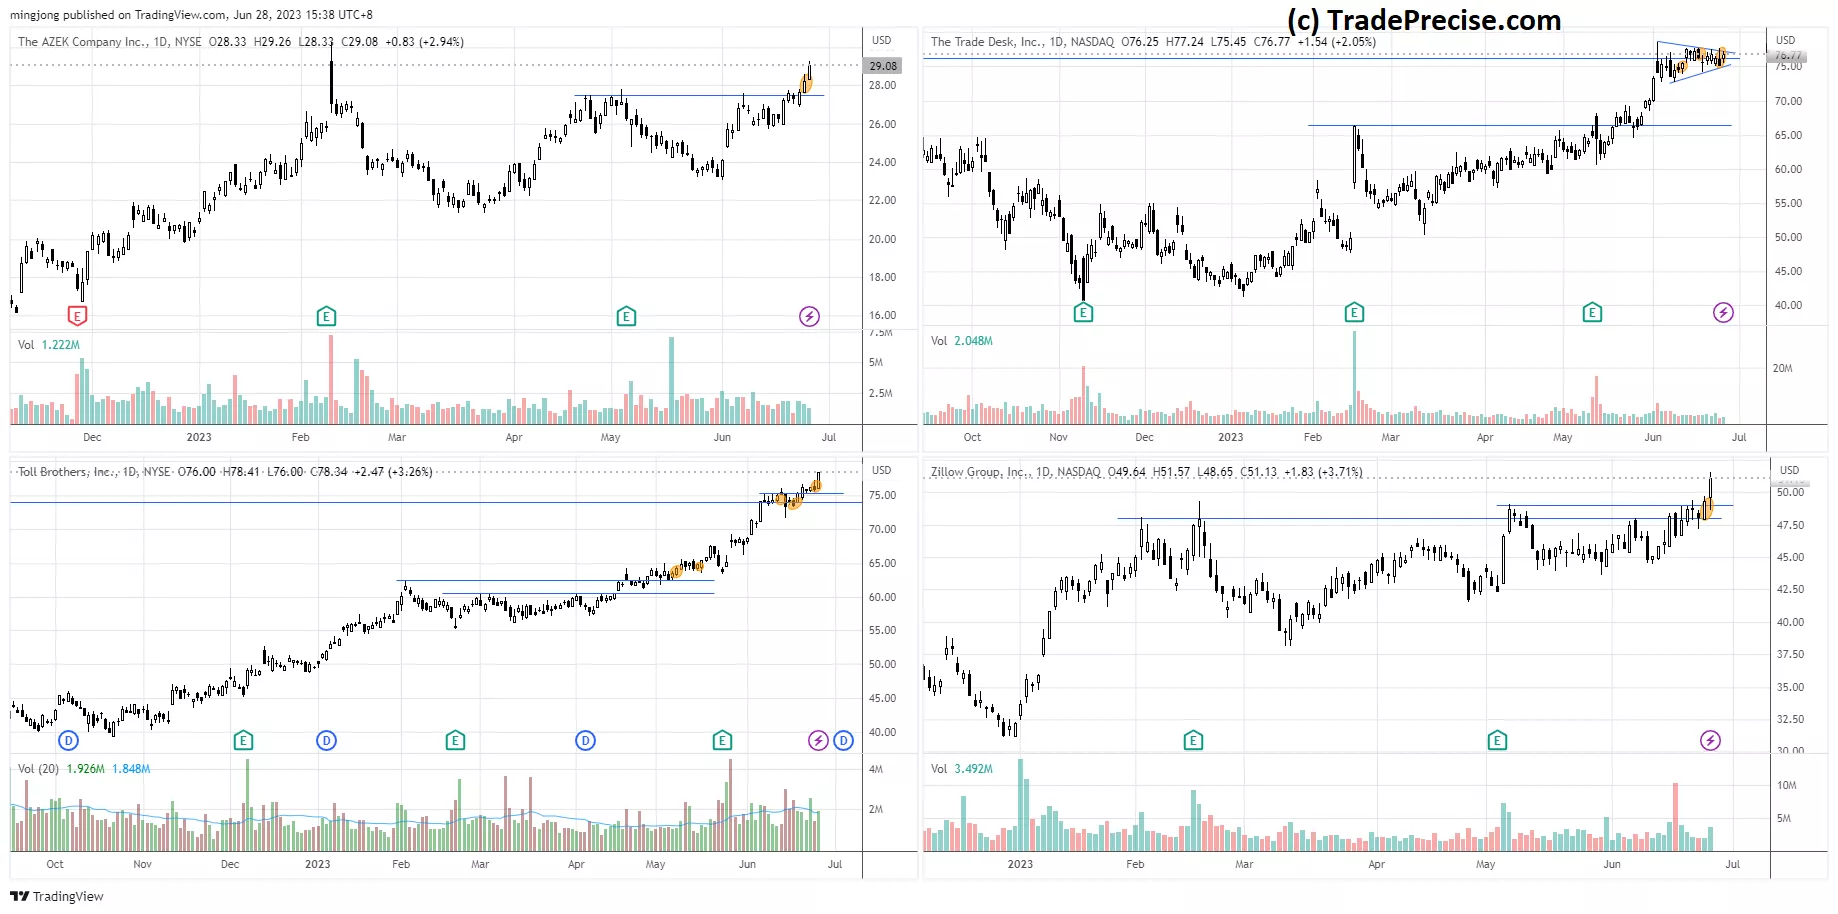
The short-term market breadth dropped below 50 confirming the market is in a pullback mode. 15 “low hanging fruits” (AZEK, TTD, etc…) trade entries setup + 28 others (TOL, Z, etc…) have been discussed during the live session.
(Click on image to enlarge)
More By This Author:
Market Breadth Signals Decoded: Crash Or Healthy Pullback?
Market Rotation Unfolding - What Nasdaq Analogue Reveals About The S&P 500's Next Move
Market Rotation Alert: Key Areas To Shift Your Attention For Potential Profits


Comments
Log in or sign up to join the conversation.