

Image Source: Pexels
In this video, you will find out the following:
- The significance of market breadth in determining the stock market's health
- How to use the market breadth signals to make more informed decisions
- The trade management I am using in this ongoing volatile market to lock in profits yet still not missing out on the potential strong trend.
- The potential path of the S&P 500 for a pullback/consolidation scenario and a market correction scenario.
- And a lot more
Video Length: 00:11:19
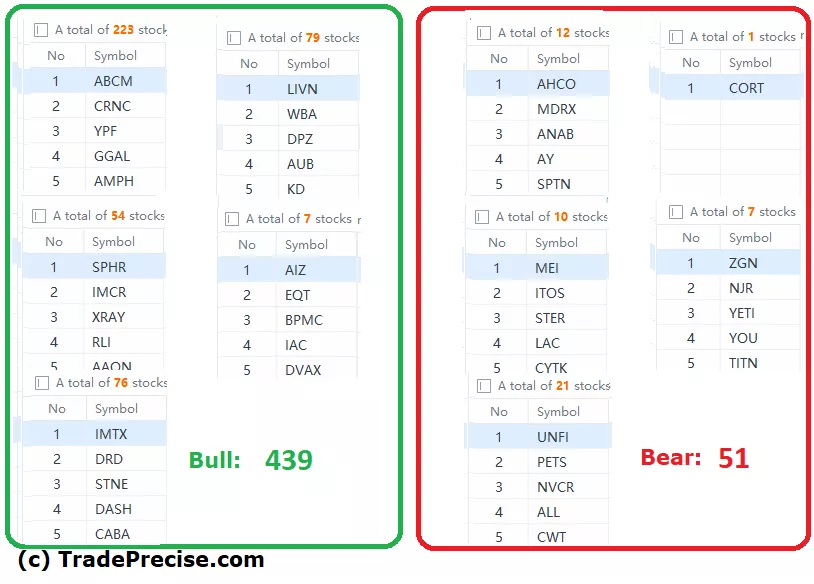
The bullish vs. bearish setup is 439 to 51 from the screenshot of my stock screener below pointing to a positive market environment.
The short-term market breadth is close to overbought suggesting strength with alert while the long-term market breadth has further improved from last week.
More By This Author:
Market Rotation Unfolding - What Nasdaq Analogue Reveals About The S&P 500's Next Move
Market Rotation Alert: Key Areas To Shift Your Attention For Potential Profits
Bifurcated Market, Lousy Market Breadth: Is A Crash Looming Or A Bull Run Brewing?


Comments
Log in or sign up to join the conversation.